Effective project status reporting starts with making sure your project stays on track, meets deadlines, and achieves its goals – with the right reporting in place.
Project status reports provide critical insights into the health of a project, allowing project managers to identify potential issues or risks and take corrective action quickly. They also help project managers to communicate progress and results to stakeholders, keeping everyone informed and engaged throughout the project lifecycle.
Project management software, like MS Project Desktop, offers a streamlined way to collect and analyze project data, enabling project managers to create detailed project status reports that provide insights into project performance.
Still, while Microsoft Project Desktop is a powerful tool for project management and status reporting, it has some limitations in online functionality.
Compared with cloud-based project management tools, such as Azure DevOps or Jira, Microsoft Project Desktop does not offer the same level of online collaboration and real-time automated reporting.
This means that users have to work on their local machine and cannot access project information from anywhere in the Cloud. As a result, PMs may find it more challenging to create project status reports that reflect the most up-to-date information and collaborate with team members in real-time.
This guide will help you create project status reports using Microsoft Project Desktop, including creating this type of reports online and making them interactive.
Whether you are a beginner or an experienced project manager, this guide will show you how to streamline your project reporting process and communicate your project status more effectively.
So, if you want to learn to create professional project status reports in MS Project, read on!
Table of contents
What is project status reporting?
Communication is the key to successful project management and delivery. A project manager’s role involves clear communication among all stakeholders, including the client, the project, and the management team.
A project status report aims to inform stakeholders of progress, identify potential issues or risks, and provide transparency on the project’s performance.
A comprehensive report reflects four major values:
- Current status: demonstrates what has been completed and achieved in regard to initial planning
- Variances: reflects missed timelines and any lags in work and efficiency
- Analysis: provides insights to evaluate if any changes and additions need to be made
- Current actionable: showcases data that helps stakeholders make an informed decision on additional action items
Project managers can create project status reports using various tools, from simple spreadsheets to more advanced project management software, including MS Project Desktop.
The key types of status reports
These reports can take many forms. By understanding the different types of project status reports and their purpose, project managers can choose the most appropriate format to meet their needs.
There are 7 types of project status reports:
1. Current period reports. These reports cover only the most recent period.
They provide updates on the actions that were ongoing or slated to be completed within a given period. Reports may emphasize finished tasks and differences between the expected and the actual completion dates.
If anything went wrong, the report should address the reasons for the deviation and suggest suitable corrective actions to make up for it.
Project managers can update project status reporting daily, weekly, bi-weekly, monthly, or quarterly.
2. External or internal reports. The status report information that clients or stakeholders need may differ from what your internal team prefers. Internal Status Reports focus more on specific activities and issues that are important to your team and contain more details. Internal reports may occasionally concentrate on fewer subjects and only perform in-depth analysis when necessary.
Instead of focusing in-depth on one issue at a time, the External Status Report will likely concentrate on a broader range of topics (unless required by the client).
3. Cumulative reports. These reports detail the project’s history from the very beginning to the end of the current reporting period.
Because these documents display trends in project progress, they are more informative than the current period reports. For instance, a schedule variance may be monitored over several subsequent periods to demonstrate improvement (or deterioration).
Project managers can create these reports at either the project or the activity level.
4. Exception reports (CEO-level reports). Managers often make these reports. Their key aim is that they can be easily read and understood by top management.
A one-page, high-level summary is typically sufficient in these circumstances. If the management needs a deeper context, we recommend including a current period report with further information.
5. Stoplight reports. Project managers can use stoplight reports with any of the previous report formats.
As more businesses recognize that countless data points in the current period report sometimes hinder more than they help, this type of report is becoming increasingly popular.
It uses a traffic light pattern to color-code project components, showing green for on-budget and on-target entities, yellow for potential risks, and red for actual roadblocks, overspending, etc.
6. Variance reports. Variance reports do exactly what their name suggests – they report differences between the plan and the reality. This report usually has three columns:
- The planned number
- The actual number
- The difference between the plan and the outcome
A variance report can have two different formats.
The first one is numeric and displays a few rows, with each row giving the actual, planned, and variance calculation for given variables.
The second format is a graphical representation of the numeric data. It might be formatted to show the plan data for each reporting period and denoted with a one-color curve. The actual data is shown for the same timeline, with a different curve color. Typical variance reports are snapshots of a project’s entity current status.
7. The monthly team and resources status report. A separate team and resource status report can be helpful if your business or team manages several ongoing and overlapping projects.
This report should include the contributions of resources and state their start and end dates.
This report provides resource managers with information on potential bottlenecks, allowing them to deploy resources effectively.
There are many types of project status reports, each aiming at its own goal.
By choosing the most appropriate type of report for their project and stakeholders, project managers can ensure that they communicate project status effectively and maintain stakeholder engagement and support.
Elements of a complete project status report
A project status report is only as effective as the information it contains. To ensure that project managers communicate progress effectively, it is essential to understand the key elements that make up a successful status report.
There are 9 key elements:
- Project details: provide the project name and code, if applicable
- Team: identify the project manager and other key team members
- Status date: specify the reporting frequency (weekly, bi-weekly, monthly, etc.) and the date of the report
- Schedule of the project: report on whether the project has achieved all the milestones for the current reporting period
- Scope: report whether the project has remained within the defined scope in the current reporting period
- Budget: report on whether the project is within, under, or over budget
- Quality: if applicable, report on any quality issues that have arisen during the reporting period
- Dependencies: report any dependencies or factors the team is waiting on before proceeding with the project
- Issues and Roadblocks: report on any issues or roadblocks that have arisen during this time, provide a brief description of the issue and the steps that the project manager plans to take to address it, and identify the person responsible for it
How to create a status report
Creating a project status report can be daunting. However, following these 4 simple steps can help you make your reports informative and actionable:
- Create an outline
Identify what your report’s target audience is. If it’s intended for the customer or the senior management, you need to prepare a broader overview of the status reporting, including resources, risks, and budgeting. For the project team, you should prepare a different set of reports with a deep analysis of its separate topics.
- Gather data
Usually, project management tools like MS Project generate all the data necessary to prepare the report. You can then create an Excel or PowerPoint report and share it with your stakeholders.
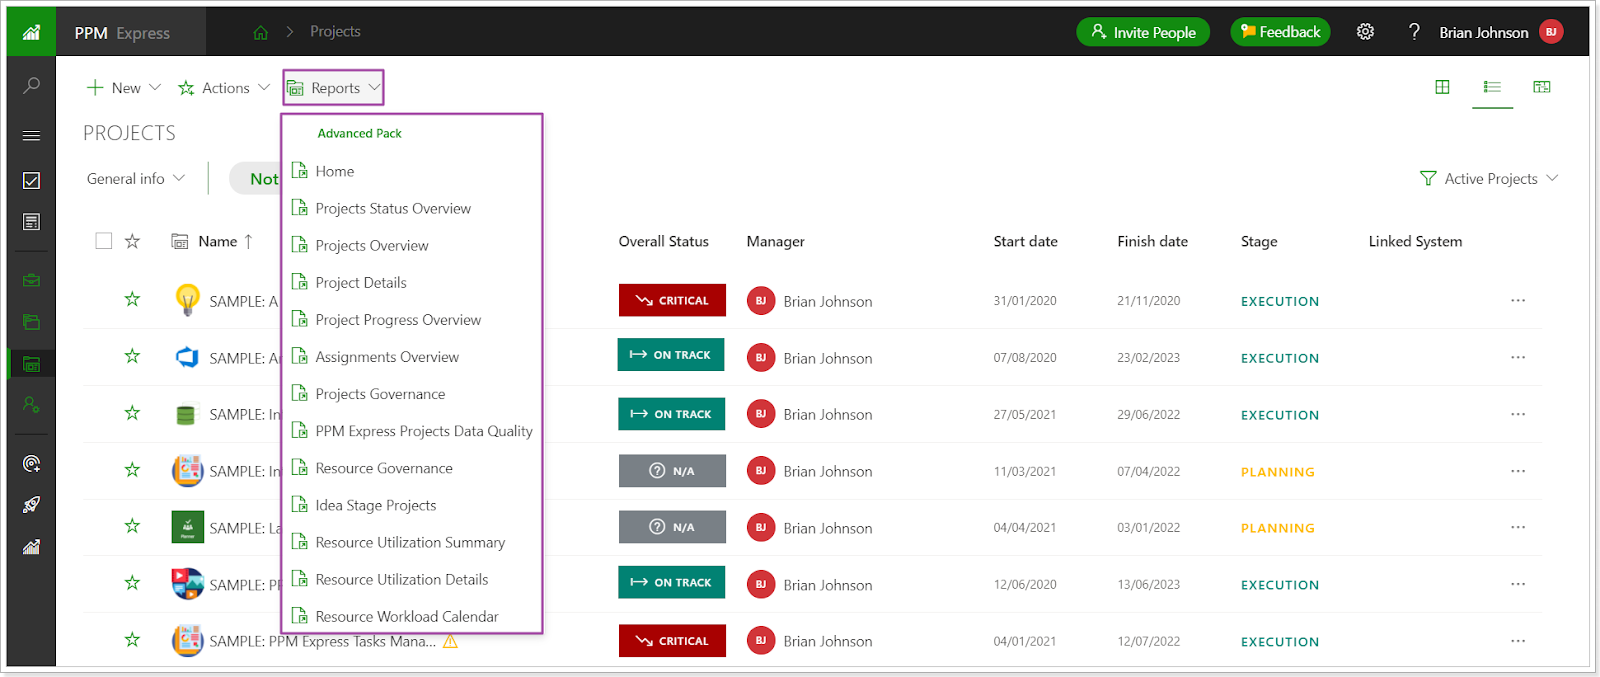
Alternatively, the reports can be autogenerated in a more comprehensive project portfolio management tool like PPM Express. You can use 150+ pre-built Power BI reports with your data from Project Desktop. The project manager is only required to fill in the summary.
- Prepare the report
Now that you have the data, it’s time to prepare the report. Describe the current status and variances and conduct the analysis.
Extra tip: avoid information overload. You can add any additional information as an attachment for reference.
Don’t forget about the summary. It shows the understanding and scope of progress to the stakeholders, builds confidence in the team as well as helping to fill in the gaps.
The management is mostly interested in the summary, so it needs to be precise, simple, and effective.
- Share the project status report
A project status report needs to be sharable, but the project manager has ultimate ownership of it.
Microsoft Project Desktop users can publish project data to PPM Express and use one of the 150+ pre-built Power BI reports. Afterward, you can share access to the reports with your stakeholders.
Examples of a project status report [+free templates]
Project managers can save time by using templates to generate project status reports.
Still, they must tailor the template to the requirements of their project. By doing this, they can develop a template that remains up-to-date and helpful as the project progresses.
To help you get started, here are some project status report templates:
- Project managers can stay updated on progress by using Microsoft’s pre-formatted project status report template
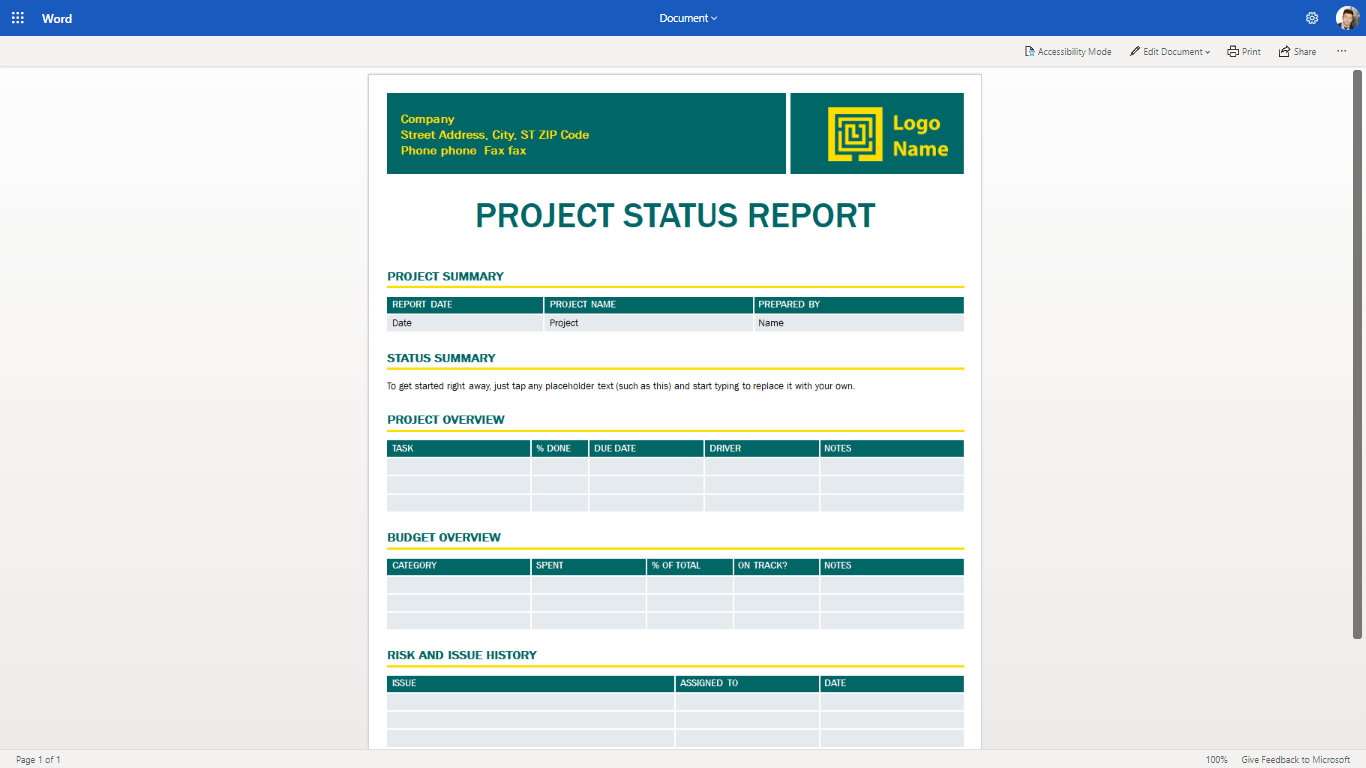
Microsoft’s status report ensures consistency and accuracy in reporting by establishing a standardized format and content.
- Arizona State University’s PMO made a Jira project status report template. It helps keep stakeholders informed about all their projects in a structured way.
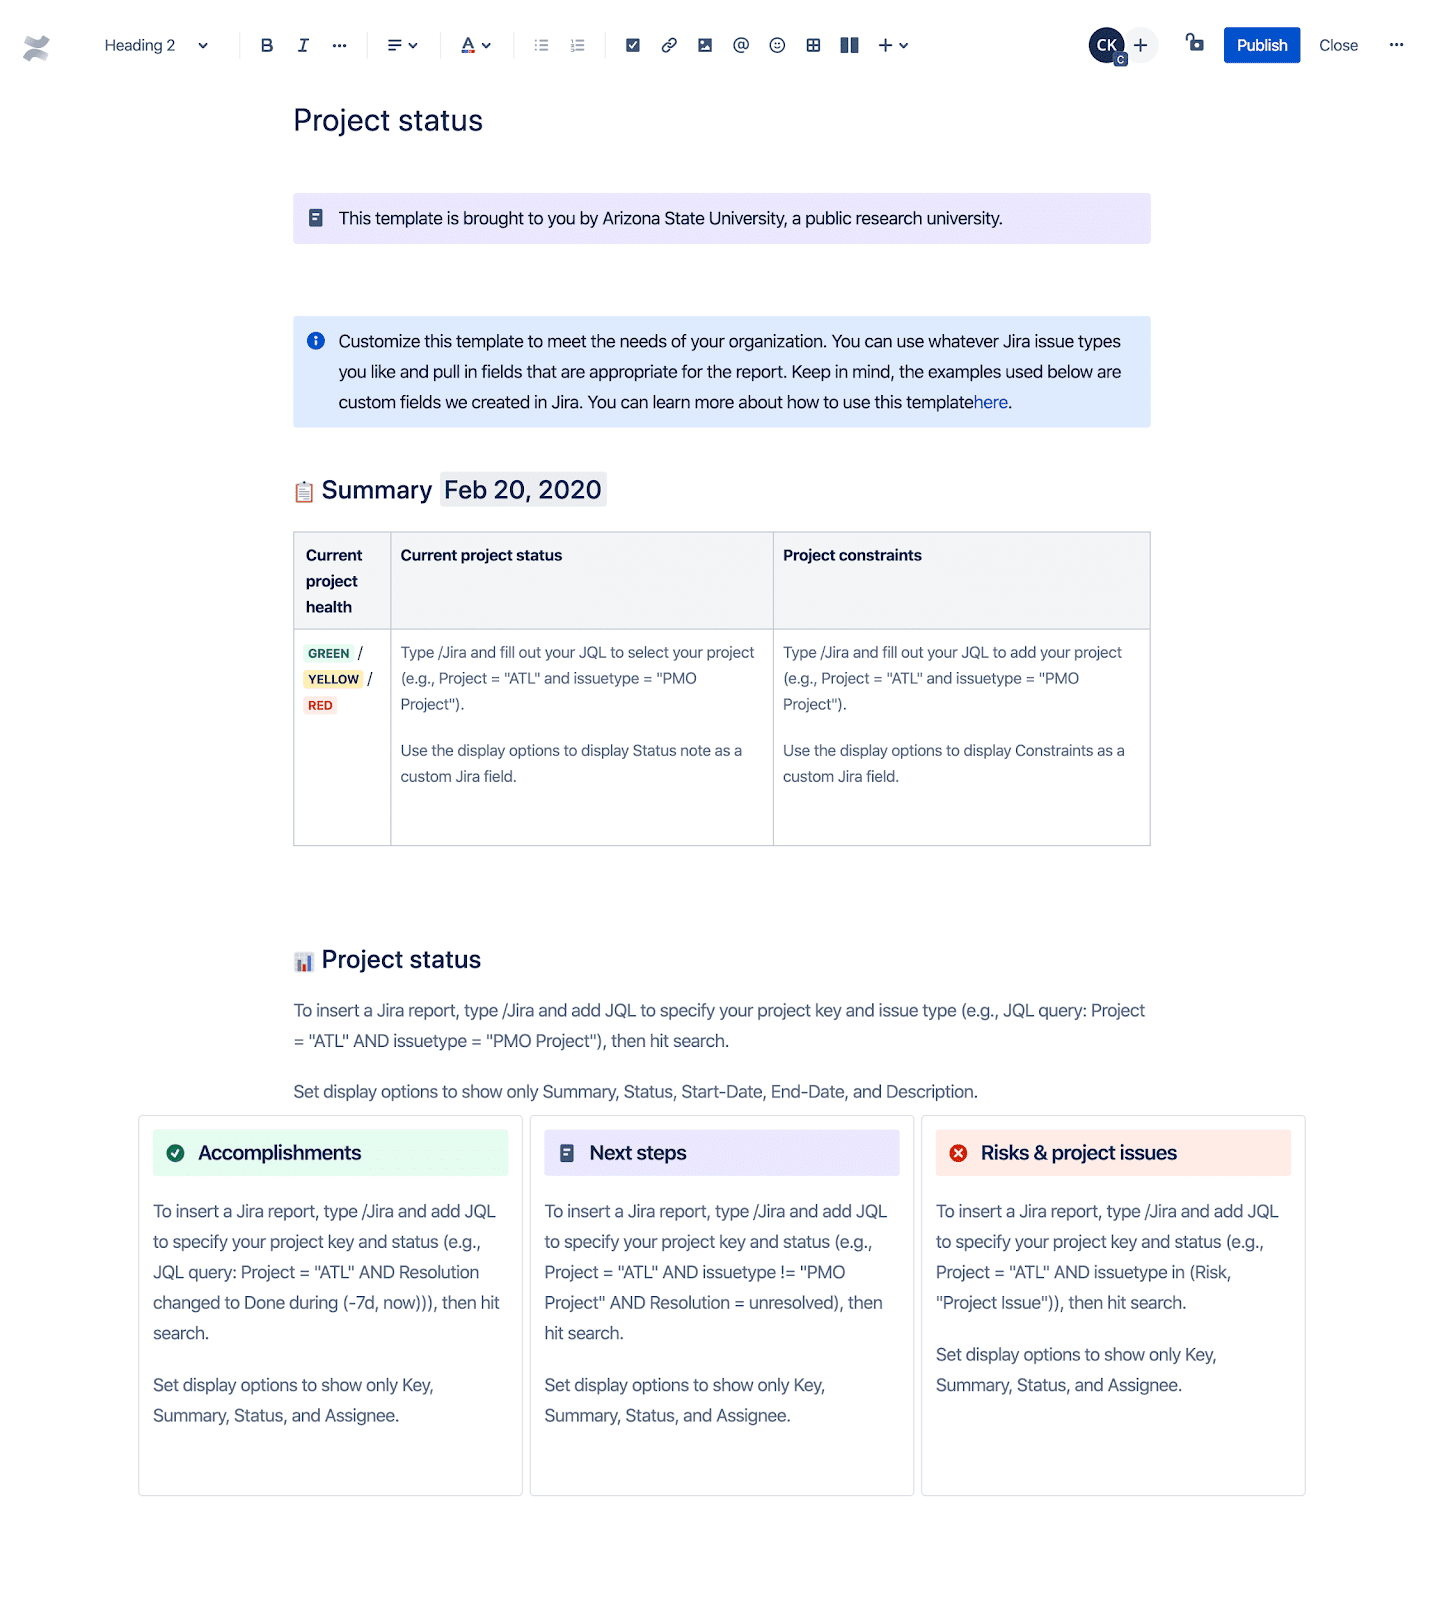
Using this template can save project managers time and effort, allowing them to focus on analyzing issues rather than formatting and organizing information.
- PPM Express provides project status reports for MS Project Desktop in Power BI as an online collaboration feature.
PPM Express’s Power BI reports help to identify project risks and provide insights into how to mitigate them.
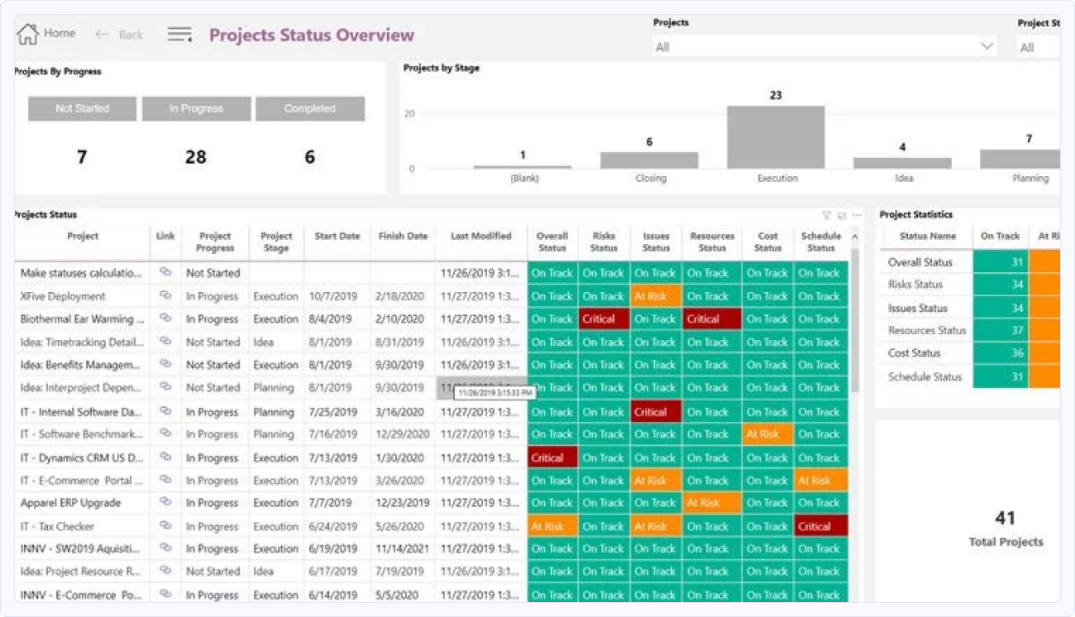
Use our collection of over 150 Power BI reports, which provide detailed insights into project and portfolio performance, risk management, and resource allocation without any manual reporting.
What is reporting software?
With the increasing complexity of modern projects, it is more important than ever to make use of reporting software like Power BI and PPM Express, which can capture and analyze project data in real-time.
Here are 5 key benefits of a project management reporting system:
- Increases efficiency and accuracy in reporting by automating data collection and analysis
- Improves visibility and transparency of project progress and performance for stakeholders
- Provides real-time tracking of project metrics, enabling timely identification and resolution of issues
- Provides customizable reporting dashboards and templates to fit specific project needs and requirements
- Enhances collaboration and communication among team members through centralized information sharing
Let’s explore the differences between manual and automated reporting.
Manual vs. Automated reporting software
Some “old-school” project managers prefer manual reporting using Microsoft Excel and PowerPoint. But this does have a few disadvantages, including:
- Requiring more time and effort from project team members to compile data and create reports
- Being prone to errors and inconsistencies due to manual data entry and formatting
- Providing less real-time visibility into project performance, as data needs to be collected and analyzed manually
- Being less scalable and adaptable when not able to handle large amounts of data or complex reporting requirements
That’s why an increasing number of companies we interact with in PPM Express are moving towards report automation. The benefits of this include:
- Improved accuracy and consistency of reports
- Increased efficiency and productivity of project team members
- Enhanced visibility into project performance that enables more informed decision-making
- Better risk management, as issues can be identified and addressed in real-time
- Reduced costs and improved resource allocation, as project managers can identify areas where resources can be optimized
Automated reporting software helps project managers to identify trends, issues, and opportunities, enabling more informed decision-making and timely action.
Must-have reporting software features
Reporting software can help project managers streamline their reporting process, making collecting, analyzing, and reporting project data easier. Here are the 8 most important reporting features to consider:
- Ability to create customizable dashboards that display the data and metrics most relevant to their project and team
- Provision of real-time data, allowing stakeholders to stay informed of the project’s progress
- Automation of reporting processes, such as data collection and analysis, to save time and improve accuracy
- Data presentation in an easy-to-understand format: charts, graphs, or tables
- Team collaboration allowing them to share data and reports and to work together to analyze and interpret data
- Robust security features to protect sensitive data and prevent unauthorized access
- Export options to various formats, such as PDF, Excel, or CSV, to share with stakeholders who may not have access to the reporting tool
- Integration with other tools and systems, such as project management software, to streamline data collection and analysis without migration processes
Checking these boxes will help you choose reporting software that fits your most crucial needs.
Benefits of Microsoft Power BI reporting software
Power BI is one of the most popular reporting tools out there. Let’s explore its benefits and see how Power BI can help streamline the project status reporting process and allow you to make informed decisions:
- Cost-effectiveness: relatively affordable for small and medium enterprises
- Seamless integration: it offers easy integration with PPM Express, Azure, Dynamics 365, Google Analytics, Oracle database, Salesforce, IBM, Amazon Redshift, etc.
- Artificial intelligence: Power BI uses AI features to integrate complex raw data into analytics dashboards
- Interactive UI/UX: the functionality and view are visually appealing and user-friendly
- Custom security feature: you can tune the risk levels according to the need of the end-user
- Excel integration: since most enterprises still rely on MS Excel spreadsheets, this Power BI feature helps integrate the Excel data into the dashboard to create data models and reports wherever
With its user-friendly interface and cloud-based platform, Power BI offers a flexible and scalable solution for project reporting.
If you’re feeling limited by MS Project Desktop when it comes to creating project status reports, read on to see how to nail it even without fancy tools.
How to build project status reports in MS Project Desktop
Microsoft Project Desktop can help project managers to create and manage complex projects. But it has some limitations, like a lack of collaboration features.
With suitable approaches and additional tools, project managers can leverage the capabilities of Microsoft Project Desktop to create project status reports.
This section will explore how to build project status reports in Microsoft Project Desktop, customize reports in Project Desktop, and provide some tips on transferring its reporting functionality online.
How to create project status reports manually
Microsoft Project Desktop offers a simple report builder to help you create custom project status reports.
While this feature may not be as robust as other online automated reporting tools, you can still leverage it to build project status reports that provide insights into project progress.
Here are some instructions on how to create project status reports manually in Microsoft Project Desktop:
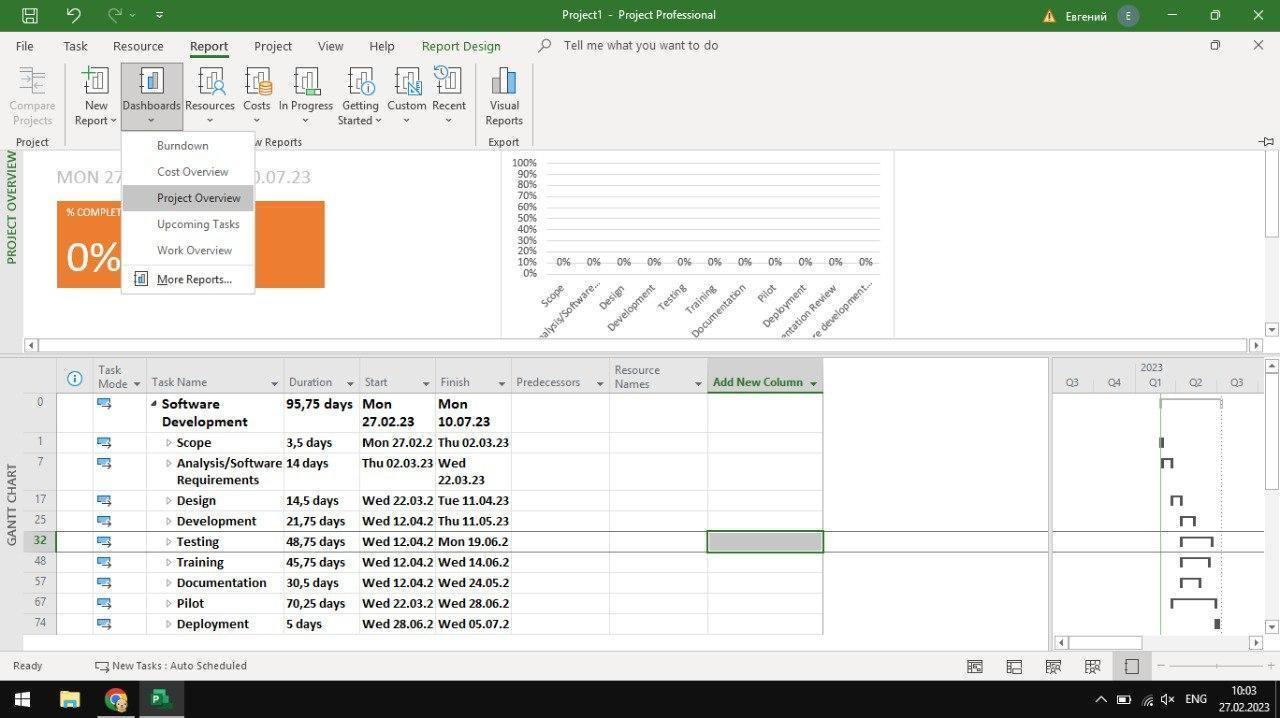
- Choose a pre-built “Project Overview” report. This represents # of completed tasks (for all top-level tasks), milestones coming soon, and tasks past due.
- You may add charts and graphs to the report at the beginning. Go to the ‘Report Design’ tab and the ‘Insert’ section. You can choose from ‘Images,’ ‘Shapers,’ ‘Charts,’ ‘Tables,’ and ‘Text boxes.’
- Decide which data to display in the report, click the target element and view the ‘Select Fields’ section. Then, select the fields you want to include in the report. You can use filters or group indexes.
- Customize the report’s layout. You can add or remove sections, adjust the size of tables and charts, and format the report to match your preferences.
- Customize the project status report’s elements. To do this, Click the ‘Report Design.’ You can choose the fields to represent, font, color scheme, and other formatting options.
- Share the project status report. To do this, click ‘Report Design’ → ‘Copy Report.’ Paste the report into any program that displays graphics. You can then share the report by printing, emailing, or sharing via a project management tool.
Microsoft Project Desktop also offers a reporting feature called Visual Reports. This allows you to create a report based on a pre-defined template that can be customized to meet your needs. To use this feature, make sure you have Microsoft Excel installed.
Using Microsoft Project Desktop to create project status reports can help effectively track project progress and communicate important information to stakeholders.
By customizing the report template, selecting the relevant data, and formatting the report to meet your needs, you can create a clear and concise project status report that will help keep everyone informed and on track.
But this approach has a limitation: the absence of collaboration and integration features.
If you’re looking for a way to take your project reporting to the next level, integrating Project Desktop with Power BI can provide real-time insights and visualizations that enable better decision-making.
Read on to discover details.
How to create MS Project Desktop project status reports with MS Power BI
Creating project status reports can be time-consuming.
Power BI helps project managers automate data collection and analysis and offers sharing functionality. Microsoft Project Desktop data can be imported to Power BI without third-party platforms.
To connect data from Microsoft Project Desktop to Power BI, follow these general steps:
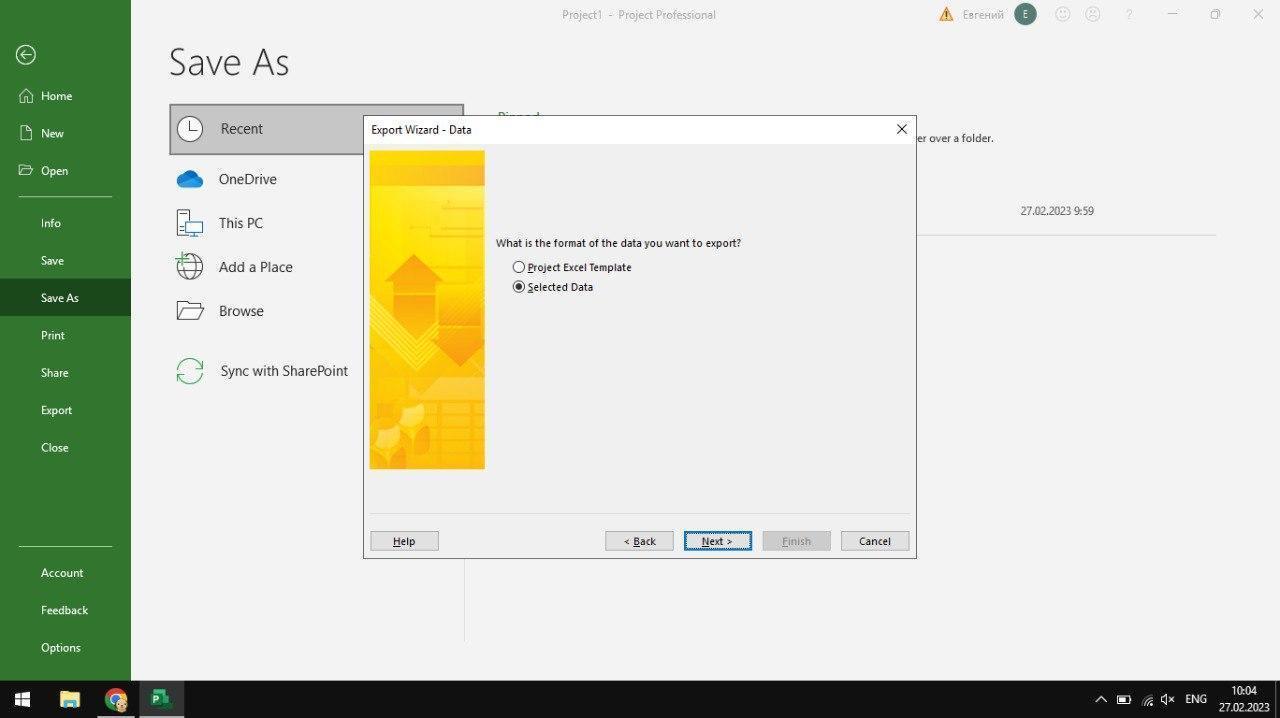
- Export your project data from Microsoft Project Desktop into an Excel file. To do this, select ‘File’ → ‘Save As,’ and choose Excel spreadsheet file format.
- In Project Desktop Export Wizard, choose from two options: ‘Project Excel Template’ (with predefined columns and rows) or ‘Selected data’ (to create your mapping)
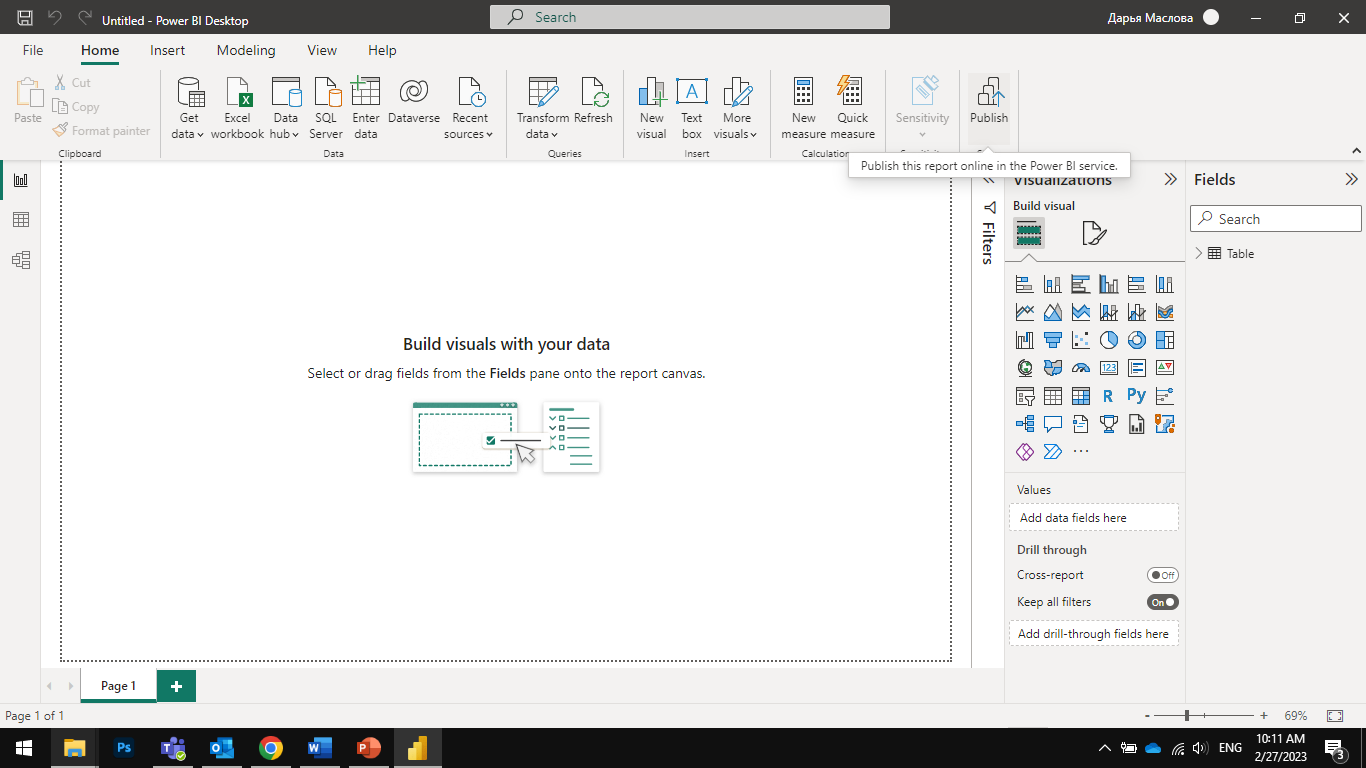
- After exporting, open Power BI Desktop and select ‘Get Data’ from the ‘Home’ tab
- Choose ‘Excel’ as the data source and select the Excel file containing your project data
- In the Navigator window, select the data you want to use and click ‘Load’
- Once the data is loaded, you can create reports using the tools provided in Power BI Desktop
Once connected, you can select the data you want to analyze. This might include tasks, resources, timelines, or other project-related data.
To make your report interactive, add filters and slicers. This can help you identify trends and patterns in your project data.
Finally, once you’ve created your report, you can publish it to the Power BI service so stakeholders can access it online.
Here’s how to do it in just 4 simple steps:
- Once you’ve created your report in Power BI Desktop, send it to the Power BI service by clicking the ‘Publish’ button in the Power BI Desktop toolbar and choosing the workspace
- After publishing your report, you’ll be able to see it in the online version of Power BI. and can make any necessary changes
- Once you’re happy with your report, you can share it by clicking the ‘Share’ button in the online version of Power BI. You can choose who to share the report with and what kind of access they will have.
- Remember to refresh your data regularly to ensure your report is up to date. You can set up automatic data refresh in the online version of Power BI to save time.
Creating a project status report in Power BI Desktop based on MS Project Desktop data is a straightforward process that can provide valuable insights into your project’s progress.
By connecting to your data source, selecting the data you want to analyze, and creating visuals that help you understand your project status, you can make a report that’s customized to your project’s needs and share it with stakeholders via the Power BI service in no time.
What if you don’t want to use Excel files, though?
How to use Power BI with MS Project Desktop without importing Excel files
While PMs use Microsoft Power BI and MS Project Desktop to create project status reports, they are not specifically designed for online collaboration and project portfolio reporting and management.
Therefore, using these tools to share project status reports can lead to incomplete or inconsistent data. And this is where PPM Express comes into play.
The integration between PPM Express and MS Project Desktop allows project managers to create project plans in MS Project Desktop and publish them into PPM Express for further analysis and online collaboration.
Once the project plans are published, PPM Express collects the project status based on the project’s actual progress, including task completion, milestone achievement, and resource utilization.
PPM Express’s integration with Power BI and MS Project Desktop makes a powerful combination to help you manage your projects and portfolios effectively.
By leveraging Power BI’s advanced data visualization capabilities, project managers can create comprehensive online project status reports for Microsoft Project Desktop that give them data-driven insights and ensure project success.
The future is automated
A qualitative approach to status reporting is crucial to align communication between all stakeholders. That makes status reporting a crucial activity that requires a systemized and process-oriented approach.
Powerful project management tools help observe and mitigate most of the risks that may sabotage the budgeting and timelines of project completion, but some of them are limited in collaboration and reporting, including MS Desktop.
If you are tired of juggling multiple spreadsheets and MPP files to manage your projects, PPM Express can help you eliminate manual tasks and focus on what you do best – actually managing projects and portfolios.
Our easy-to-deploy platform can streamline your Microsoft Project Desktop experience by automatically tracking progress, enabling you to collaborate with team members online, and visualizing and analyzing your project status data online in real-time.
PPM Express seamlessly integrates with MS Project Desktop and Power BI, so you can keep working with the tools you’re used to while taking advantage of our powerful features.
Discover why PPM Express is the preferred choice for thousands of project managers worldwide.