For a long time, Microsoft Project Desktop has been the go-to tool for project management professionals, and for a good reason. It's a powerful, feature-rich tool that can help you plan, execute, and track projects while on a steep learning curve.
However, as the business world becomes increasingly digitized and remote-oriented, many teams find that traditional desktop-based project management tools like Microsoft Project Desktop are no longer sufficient.
And that's where online collaboration comes in. Incorporating online collaboration into your project management workflow can improve communication and transparency, increase team productivity, and streamline your project management process.
But how do you bring online collaboration into your Microsoft Project Desktop setup? PPM Express makes the process very straightforward.
This comprehensive guide will show you the first four steps for integrating online collaboration into your Microsoft Project Desktop setup using PPM Express.
Whether you're using Microsoft Project Professional or the Standard version, these four steps can help you improve collaboration and communication among your team members, share project statuses and portfolio reports easily, and track project progress in real-time.
Table of contents
- What is project collaboration?
- Basic offline project collaboration features to use in MS Project Desktop
- How to transform MS Project Desktop into an online collaborative work environment with PPM Express
- Use MS Project Desktop to collaborate with teammates in MS Teams
- Utilize automated Power BI dashboards with MS Project Desktop Data
- Integrate Microsoft Project Desktop with Project Online and Project for the Web
- Connect Azure DevOps, Jira Software, and Smartsheet with MS Project Desktop
- Publish your Microsoft Project Desktop files to the Cloud with PPM Express
- Is it possible to collaborate online with Project in MS Project Desktop?
What is project collaboration?
Project collaboration is the process of working as a team to accomplish a common goal. It involves coordinating efforts, sharing information, and communicating among team members to complete a project.
Collaboration is crucial for the success of any small, medium, or large project. It allows teams to work together effectively and efficiently, leading to better project outcomes with fewer resources.
One thing is certain, though: from the first stages of the project's conception to its completion, everyone involved should collaborate and clearly understand what is expected of them.
The advantages of an efficient project collaboration process
Project teams typically include members with a variety of perspectives and backgrounds. Even the most skilled managers occasionally have trouble handling them well.
In project management, you risk losing sight of your desire to create a collaborative environment when several deadlines loom, and you face pressure from management or clients. And here, an efficient project collaboration process can bring several benefits to your team, including:
- Improved communication and transparency.
- Increased team productivity.
- A streamlined project management process.
- Better project outcomes.
- Better idea crowdsourcing.
Overall, collaboration can increase the sense of community, engagement, and productivity among your team. And this might result in more successful initiatives in the future.
Where teams typically face bottlenecks in collaboration
About 33% of projects fail because the people involved show no interest in the endeavor. Teams can often face collaboration constraints, but it happens especially when:
- They lack straightforward project and communication plans.
- They have difficulty scheduling and managing dependencies.
- They lack the right tools and technology to facilitate collaboration.
- They have trouble managing projects in a remote or distributed work environment.
To solve these barriers to a collaborative environment, it's best to decide where all your project information, correspondence, and reports will be kept so they can be used most effectively. Pro tip: one collaboration platform is better than several sources of truth contradicting each other.
To ensure everyone uses project management tools like Microsoft Project Desktop the same way, train and mentor your team regularly.

5 Pro Tips to Improve Team Collaboration
It's crucial to remember that having the correct tools is important, but utilizing them effectively is also essential in today's digital workplace.
Poor communication, a lack of knowledge of roles and responsibilities, and a lack of trust among teammates are the main cooperation obstacles, as they are with any group project. Don't let that stop you, however.
You can learn how to effectively interact at work with the help of our best practices, which aim to help you improve team collaboration:
- Use cloud-based project management software to facilitate communication and collaboration.
- Create a clear project plan that lays out the project schedule, dependencies, and milestones.
- Use scheduling and management tools to help manage dependencies and keep the project on track.
- Encourage open communication and transparency among team members.
- Regularly review and adjust your collaboration process as needed to address any bottlenecks that arise.
By using a cloud-based project portfolio management platform like PPM Express, teams can improve collaboration and communication with Microsoft Project Desktop by tracking progress in real-time, scheduling resources and mitigating risks, and managing projects and portfolios better in a remote or hybrid work environment.
So it is the perfect combination for teams looking to improve their collaboration process and solve a range of problems, like time and cost overruns, low productivity, poor quality, and customer dissatisfaction in multi-partner projects, to bring more transparency, communication and productivity to their projects.
Basic offline project collaboration features to use in MS Project Desktop
Microsoft Project Desktop is a popular project management tool that can help teams easily and quickly plan, execute, and track projects. Getting started with Microsoft Project might be easy, but mastering it is challenging.
However, as more teams work remotely and projects become more sophisticated, many project managers look for ways to collaborate closely with their teams. Fortunately, MS Project Desktop offers several essential offline collaboration features to help teams work together and stay on top of project progress.
See all project progress in Gantt view in MS Project Desktop
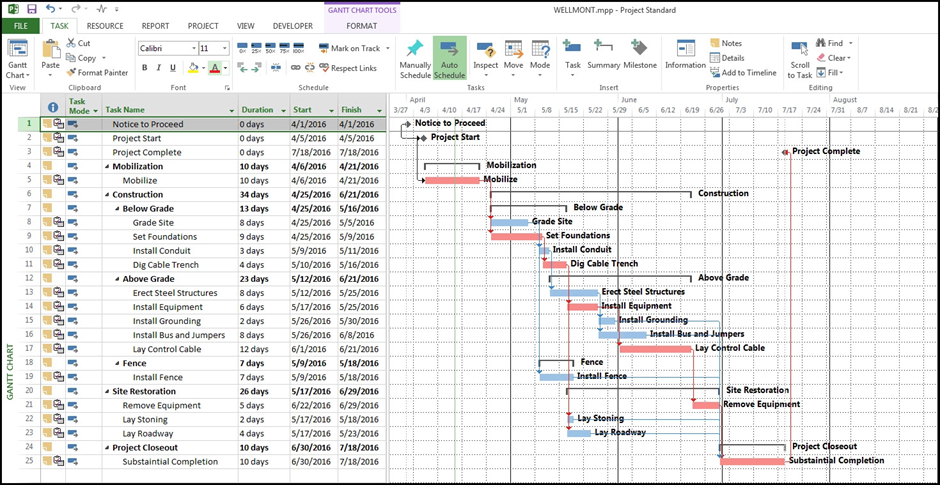
One essential Microsoft Project Standard and Professional feature is the ability to see all progress on a project in the Gantt chart view. It's a powerful visualization tool that can help you track project progress, tasks, resources, and dependencies.
With MS Project Desktop, you can easily create a Gantt chart of your project and share it with team members as an MPP file by sending it via email or MS Teams. This allows team members to see the overall project progress and take action to keep the project on track.
The Gantt chart in MS Project Desktop is easy to use and highly customizable. Teams can adjust the view to their needs and preferences. The Gantt chart can be filtered and grouped by criteria such as task status, resources, etc.
Additionally, it allows teams to drill down into specific tasks and see their details, such as task duration, dependencies, and assigned resources.
Schedule tasks and resources with Microsoft Project Desktop calendar
MS Project Desktop also offers a calendar view, which can help you schedule tasks and resources quickly. Using it, you can assign tasks to team members, set deadlines, and track progress.
Base, project, task, and resource calendars are the four different types of calendars available in Microsoft Project Standard and Professional:
- Base calendars are almost like a template for the project, task, and resource calendars.
They specify the typical working and non-working hours for each project inside your company. They detail the workdays and hours for every day of the week and any exceptions, such as company holidays.
Microsoft Project Desktop has three pre-configured default base calendars: Standard, 24 Hours, and Night Shift.
- Calendars for projects, resources, and tasks start with a base calendar as a template and are then adjusted to represent the particular working days and hours for each project, resource, or task.
These unusual calendars are handy for keeping track of things like leaves of absence, shift employment, or duties carried out by machinery that operates on the weekends and evenings.
Build and share MS Project Desktop Reports
MS Project Desktop also offers a range of built-in reports that help you assess the efficiency of your project. You'll find all of them on the Report tab.
There are a few options to choose from:
- Dashboard reports to evaluate the number of tasks accomplished, the number still unresolved, the project's current cost state, and the completion status.
- Resource reports to comprehend the work status for all allotted resources, displaying their current, unfinished work and the work status of everyone.
- Cost reports show costs and cumulative costs per quarter and performance indices over time. They let you compare costs and schedules to a baseline to determine if your project is on track.
- Progress reports combine all tightly scheduled tasks identified as critical on your project's critical path, all tasks begun or completed after the planned dates, and any trailing tasks.
Additionally, you can use one of the report templates to generate your project reports if a predefined report does not match your needs.
The export options let you export an Excel file and edit it as needed or a PDF file to share these reports with team members and stakeholders. This can help improve communication and transparency.
While MS Project does not offer advanced online collaboration features, these basic offline collaboration features can still help teams work together and stay on top of project progress.
With the right project plan, task management, and Gantt chart, teams can effectively manage agile projects, collaborate on project plans, and use cloud-based management software like PPM Express to access and update project plans.
How to transform MS Project Desktop into an online collaborative work environment with PPM Express
Microsoft Project Desktop is an incredible project management tool but lacks online collaboration features. Fortunately, with the help of PPM Express, you can easily and quickly connect MS Project Desktop to an online collaborative work environment.
Let's look at how PPM Express can help you transform MS Project Desktop into the future of collaborative project management.
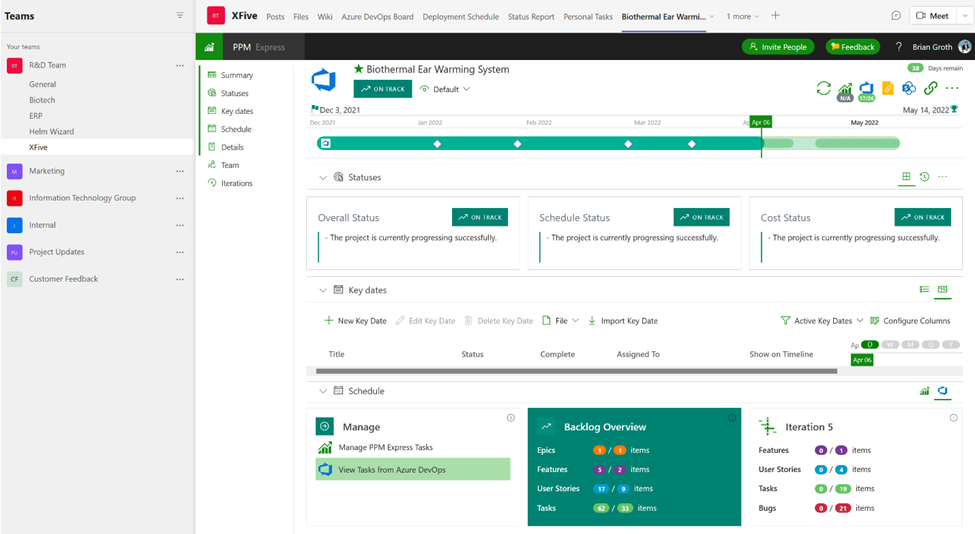
Use MS Project Desktop to collaborate with teammates in MS Teams
PPM Express integrates with MS Teams, which allows you to chat with teammates, get access, and share information effortlessly.
With MS Teams integration functionality, you can get the following:
- View Gantt charts for tasks from Microsoft Project Desktop or use PPM Express task management right in MS Teams.
- Access 150+ prebuilt Power BI status reports directly next to the project dashboard and chat in Office 365 Teams.
- View your tasks and assignments across all your project management tools, including Jira Software, Microsoft Project Desktop, Online and Project for the Web, Azure DevOps Boards, Microsoft Planner, and Smartsheet.
- Utilize Microsoft Teams to organize resources and build roadmaps.
When you use the PPM Express app for Microsoft Teams, all project management features are available as a tab in your MS Teams channel, allowing you to browse projects and portfolios, view their status, and keep track of progress.
This can help improve communication and transparency among team members and keep everyone on the same page regarding project progress.
Utilize automated Power BI dashboards with MS Project Desktop Data
One of the key benefits of using PPM Express in integration with MS Project Desktop is the ability to use automated Power BI dashboards as a powerful tool that can help show project progress, indicate risks, and manage resources.
With PPM Express, you can easily integrate over 150 Power BI reports into your Microsoft Project Desktop management workflow, allowing you to track project status, risks, issues, and project workflows and prioritize tasks.
This helps project managers perform effectively without the manual work of creating reports and dashboards with Microsoft Excel and PowerPoint, with the significant advantage of accessing real-time data and making data-driven decisions.
Integrate Microsoft Project Desktop with Project Online and Project for the Web
PPM Express also integrates with Project Online and Project for the Web, which allows you to manage your project portfolio and track progress, statuses, deadlines, and milestones on a single dashboard.
It can reduce migration efforts by up to 70% and save tens of thousands of dollars on implementation, deployment, consulting, and the integration of custom-built solutions.
Integration with Project Online and Project for the Web also allows teams to manage their project portfolio, which can help them identify and prioritize projects that are most critical to the organization.
Connect Azure DevOps, Jira Software, and Smartsheet with MS Project Desktop
PPM Express lets you connect projects from third-party tasks and project management tools like Azure, Microsoft Planner, Jira, Monday, and Smartsheet.
This can help you streamline your project management process and make managing projects from different platforms from the Microsoft Project tools family easier, allowing you to see the "big picture" of all the projects in your portfolio, as well as financial analytics and budgeting information.
With real-time updates and the ability to import project plans and tasks, teams can stay on top of critical-path tasks, identify bottlenecks and take action to keep their projects on schedule.
This leads to better project outcomes and improved productivity across all projects, regardless of their complexity.
Publish your Microsoft Project Desktop files to the Cloud with PPM Express
With a few clicks, you can access a "big picture view" of all projects and statuses in a single dashboard within PPM Express, expanding the collaborative features of Microsoft Project and building real project portfolio management experience in it.
https://vimeo.com/778839150
You can group your projects into programs and portfolios after publishing projects from Microsoft Project to keep track of the following project management activities:
- Statuses of projects.
- Project schedule and details.
- Project costs and budget.
- Risks, issues, and change requests.
- Resource plans and utilization.
Do you think Microsoft Project Desktop lacks roadmaps? You can add projects, tasks, ideas, and objectives to your roadmaps from Microsoft Project Desktop to utilize them to convey a plan to your stakeholders and track progress with the help of PPM Express.
Is it possible to collaborate online with Project in MS Project Desktop?
Collaboration is a crucial aspect of project management, and MS Project Desktop lets you do just that. However, it may not be as efficient or straightforward as working in an online work environment.
With the help of PPM Express, teams can quickly transform MS Project Desktop into an online collaborative work environment.
PPM Express offers a range of features that can help teams create project plans and Gantt charts, manage tasks, and more. Using PPM Express, teams can easily improve collaboration and communication, track project progress in real-time, mitigate risks, and manage projects in remote or distributed work environments.
PPM Express also allows Microsoft Project Desktop teams to integrate with MS Teams, PowerBI, Project Online, and Project for the Web and connect projects from third-party PM tools like Azure, Jira, Monday.com, and Smartsheet, which can help improve your Microsoft project management workflow.
PPM Express can help teams get the best output from their Microsoft Project Desktop and make collaboration a breeze. So, give PPM Express a try to improve your team's cooperation and efficiency.