As a CTO, project manager, or portfolio manager, you're responsible for ensuring that your team meets project goals and deadlines.
But with multiple projects, tasks, and team members to manage, it can take a lot of time to keep track of everything and ensure that projects run smoothly.
That's why Gantt charts have become a go-to tool for project management professionals. They help you keep projects on track and ensure all team members are aligned with project goals. How? By visualizing project timelines, tracking progress, and identifying potential roadblocks.
With our ultimate how-to guide, you'll learn how to create a Gantt chart in MS Planner, customize it to your needs, and leverage it to manage your portfolios and projects more efficiently in 3 simple steps.
Read on to discover how to bring the Gantt chart to MS Planner with our step-by-step guide.
Table of contents
- A brief introduction to Microsoft Planner
- MS Planner's reporting and analysis features
- Exploring Planner’s limitations and constraints
- What is PPM Express?
- How to connect MS Planner to PPM Express?
- How PPM Express works with Microsoft Planner to build Gantt Charts
- Enhance your Microsoft Planner experience with PPM Express
- FAQ (Frequently Asked Questions)
A brief introduction to Microsoft Planner
Planner is a versatile project management tool. It is designed to streamline task organization, team collaboration, and progress tracking for businesses of all sizes.
As part of Microsoft's productivity suite, Planner seamlessly integrates with other Office 365 applications and the Microsoft ecosystem.
https://www.youtube.com/watch?v=V8qYLDJ0_fg
Planner provides the following features:
- Task management and organization
Planner allows you to create plans as individual projects and break them down into tasks. Each task can be assigned to one or more team members. Users can add a due date and a priority level, the progress of which can be clearly seen in a Board view.
- Collaboration and communication
Microsoft Planner is built with team collaboration in mind. Its integration with Microsoft Teams enables real-time communication and file sharing among team members.
Each task has a comments section for discussing details, sharing updates, or clarifying any issues that may arise.
- File attachments and checklists
To help keep relevant information organized and accessible, Planner allows you to attach files directly to tasks, making it easy for team members to find and reference important documents.
You can also create checklists within tasks to break down complex assignments into smaller, more manageable steps.
- Notifications and progress tracking
Microsoft Planner's notification system keeps team members informed of any changes or updates, ensuring everyone stays in the loop.
The tool also offers built-in progress tracking through various charts. These charts include a pie chart that displays task completion rates and a bar chart that shows the distribution of tasks across different categories.
Let’s take a look at it.

MS Planner's reporting and analysis features
Microsoft Planner offers built-in analytics and reporting features to help users monitor project progress and identify potential bottlenecks.
These features can be accessed through the "Charts" tab within each plan. Let’s dive into details about each of the Charts elements.

Task Overview pie chart: provides a visual representation of the tasks' distribution by status, such as "Not Started," "In Progress," “Late,” and "Completed."
This chart offers a quick glance at the plan's overall progress, helping project managers identify areas that need attention or additional resources.
Bucket bar chart: a visual representation of tasks and their respective categories (predefined stages from the Board) within a project, making it easier for users to organize, prioritize, and track progress.
Priority bar chart: displays the number of tasks at each priority level (“Urgent,” “Important,” “Medium,” and “Low”) in a project.
The chart allows project managers to quickly see if they have an appropriate balance of high-priority and low-priority tasks.
Task Assignment bar chart: displays the distribution of tasks assigned to each team member. Each bar represents a team member, and the length of the bar shows the number of tasks they have been assigned.
The bars are color-coded to indicate the status of the tasks, which helps project managers identify workload imbalances or potential bottlenecks among team members.
Tasks list: On the right, you'll find a list of tasks sorted by stage.
This list allows project managers to monitor upcoming deadlines and ensure that tasks are completed on time. Each task is color-coded based on its status, which makes it easy to identify tasks that may require immediate attention.
You can also filter tasks by criteria: status, priority, assigned team members, etc.
Additionally, you can group tasks by various categories, like due dates or buckets, for better organization and analysis.
Exploring Planner’s limitations and constraints
It's also essential to be aware of Microsoft Planner's limitations, which may impact the efficiency of your project management experience:
Limited customization: while Microsoft Planner offers customizable task categories and the ability to add labels, its customization options are relatively limited compared with other project management tools in the Microsoft family.
For one, you can’t create custom fields for tasks or modify the appearance of the task board to suit your needs better.
Scalability issues: Microsoft Planner is best suited for small to medium-sized projects with relatively straightforward structures.
Large, complex projects may be challenging to manage within Planner due to a lack of advanced features, such as cross-project dependencies, portfolio-level reporting, or Gantt charts.
Basic reporting features: although Planner provides built-in analytics features like pie charts and bar charts, these reporting options are basic.
Those who require more advanced reporting capabilities may find Planner's built-in analytics insufficient for their needs.
Lack of Gantt chart support: Gantt charts are crucial for visualizing project timelines, dependencies, and resource allocation, so not having them is a significant drawback for project managers who rely on these visual aids.
Fortunately, integrating Gantt charts into MS Planner is possible through third-party tools like PPM Express.
Dependency management: Planner does not natively support creating and visualizing task dependencies, which makes managing projects with multiple interrelated tasks difficult.
This limitation can be especially challenging for project managers who need to identify critical paths and understand the impact of potential delays on the overall project timeline.
Despite these limitations, Microsoft Planner remains a popular and effective project management tool for many organizations, particularly those already using the Microsoft ecosystem.
By using tools like PPM Express alongside Planner, users can improve their project portfolio management experience. PPM Express adds advanced reporting features, dependencies, and Gantt chart support, helping users overcome some of Planner's limitations.
Let’s discover how to expand MS Planner functionality this way.
What is PPM Express?
PPM Express is a cloud-based platform that offers powerful project and portfolio management capabilities, focusing on seamless integration with popular project management tools like Microsoft Planner, Azure DevOps, Jira, Smartsheet, and more.
It aims to bridge the gaps between these tools, providing users with a comprehensive and efficient project portfolio management experience.
By connecting your MS Planner projects with PPM Express, you can create and customize Gantt charts to visualize your project timelines, task dependencies, and resource allocation and add advanced reporting and analytics features to your toolstack via native integration of your MS Planner with Power BI.
PPM Express is designed to integrate seamlessly with MS Planner, making it easy to connect your existing projects and start leveraging the platform's advanced features immediately.
Let’s discover the connection process between MS Planner and PPM Express in 3 simple steps.
How to connect MS Planner to PPM Express?
Connecting your Microsoft Planner projects to PPM Express is a straightforward process that allows you to unlock the full potential of your project portfolio management experience:
Step 1: Log in to PPM Express

Once you've signed up for an account, log in to PPM Express using your credentials. Upon logging in, you'll be directed to the PPM Express Quick Start page.
Step 2: Connect Microsoft Planner
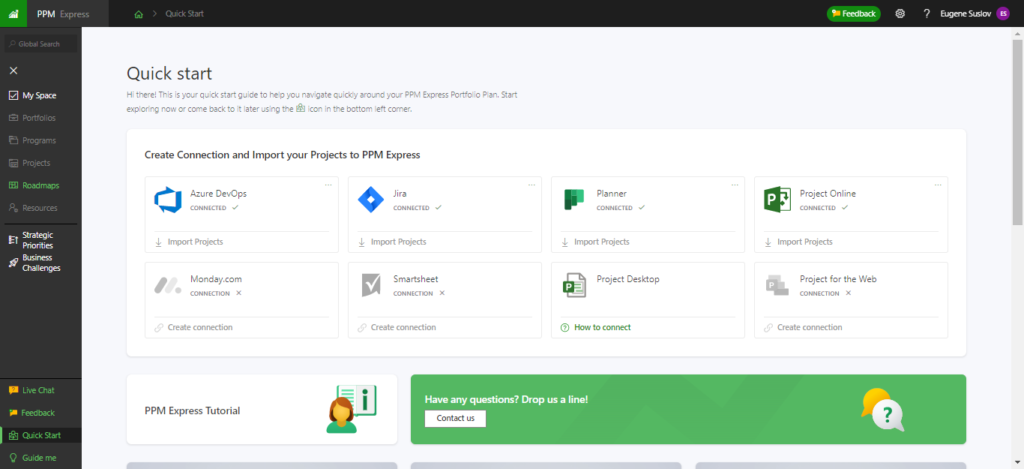
On this page, you'll find a list of supported project management tools, including Microsoft Planner. Click the "Create connection" button next to Microsoft Planner and authorize the connection.
https://vimeo.com/685413402
Step 3: Import your Plans from MS Planner to PPM Express
At this stage, you'll be presented with a list of your existing Planner projects.
Select the projects you want to integrate with PPM Express and click the "Import" button.

This will automatically import your selected projects, allowing you to manage them within the PPM Express platform.
Now that your MS Planner projects are connected, you can use the platform's advanced features, such as Gantt chart visualization, improved reporting, and project portfolio management.
Let’s discover how.
How PPM Express works with Microsoft Planner to build Gantt Charts
Let’s explore how PPM Express works with MS Planner and the benefits of using these two tools in conjunction to gain valuable insights into their projects and portfolios, ultimately leading to better project outcomes.
One of the most powerful features of PPM Express is the ability to view and manage your entire project portfolio using the Gantt chart view.
Here are the benefits and capabilities of the Gantt chart view for portfolio management in PPM Express with MS Planner integration:
Holistic portfolio visualization
The Gantt chart view in PPM Express provides a high-level overview of all your integrated MS Planner projects in a single view.

This consolidated visualization allows you to easily assess the progress, dependencies, and resource allocation across your entire portfolio, ensuring alignment with organizational goals and facilitating better decision-making.
Customization and filtering
PPM Express offers a range of customization options for the Gantt chart view, allowing you to tailor the display to your needs.
You can filter projects by various criteria, such as status, priority, or assigned team member, and even adjust the timescale to focus on specific timeframes.
Real-time updates and synchronization
PPM Express continuously synchronizes with your Microsoft Planner projects, ensuring that any changes made in Planner are automatically reflected in the Gantt chart view.
By leveraging the Gantt chart view feature in PPM Express with MS Planner integration, you can unlock a powerful, visually intuitive way to manage your entire project portfolio.
Enhance your Microsoft Planner experience with PPM Express
Microsoft Planner is an effective project management tool with various features to facilitate task organization, team collaboration, and progress tracking.
However, its lack of native Gantt chart support can be a significant limitation for project managers who rely on these visual aids to effectively manage project timelines and dependencies.
By integrating PPM Express, you can overcome this limitation and unlock the full potential of your project portfolio management experience.
PPM Express brings much-needed Gantt chart functionality to MS Planner and provides advanced reporting, portfolio management, and improved analytics features. By following the steps outlined in this guide, you can seamlessly connect your MS Planner projects to PPM Express and enjoy an enhanced project portfolio management experience.
Sign up for a free trial of PPM Express and discover how it can transform your Microsoft Planner experience into a comprehensive project management solution that drives better results.
FAQ (Frequently Asked Questions)
What is a Gantt chart, and why is it useful for project management? A Gantt chart is a visual representation of a project schedule that shows project tasks' start and end dates and the dependencies between them. It's useful for project management as it provides a clear, easy-to-understand view of a project's timeline, allowing project managers to identify potential bottlenecks, prioritize tasks, and allocate resources effectively.
Can I create a Gantt chart directly within Microsoft Planner? Microsoft Planner does not have a built-in Gantt chart feature. However, you can integrate Planner with third-party tools like PPM Express to visualize your project timeline as a Gantt chart and unlock additional project management features.
Is the integration with PPM Express difficult or time-consuming? Integrating Microsoft Planner with PPM Express is a simple process that takes just a few minutes. The integration is user-friendly and doesn't require advanced technical knowledge. Simply follow the step-by-step instructions provided in the article to connect your MS Planner projects to PPM Express.
Do I need a separate subscription for PPM Express? Yes, PPM Express is a separate tool with its own subscription. However, the investment is worthwhile, as it provides a wealth of additional features, such as Gantt chart visualization, resource management, budgeting, and advanced reporting through Microsoft Power BI.
Can I collaborate with my team in real-time when using PPM Express with MS Planner? Absolutely! PPM Express integrates seamlessly with MS Planner, ensuring real-time data synchronization between the two platforms. This enables project managers and team members to collaborate effectively, ensuring everyone can access the most current information and make informed decisions.
What if I need to customize my Gantt chart or apply filters to view specific projects or tasks? PPM Express offers a range of customization options and filters, allowing you to tailor the Gantt chart view to your specific needs. You can filter projects by various criteria, such as status, priority, or assigned team member, and even adjust the timescale to focus on specific timeframes.