Are you struggling to make informed decisions based on the data from your Jira projects? Do you spend hours sorting through reports to find the insights you need?
If the answer is yes, you're not alone.
Many project managers and teams face the same challenge of making sense of the vast amount of data generated by their projects.
Fortunately, there's a solution that can help you unlock the insights buried in your Jira data.
In this article, we'll explore how you can use Jira reporting to its full potential and get the most out of your project data.
So, keep reading if you're ready to take your Jira reporting to the next level and unlock the insights you need for better decision-making.
Table of contents
- Importance of data-driven decision-making for portfolio, project, and program managers
- Benefits of using Jira's reporting features for decision-making
- Quick overview of Jira's built-in reports and their functions
- Advanced techniques and add-ons for enhanced Jira reporting
- Top 3 integrations and third-party add-ons for building robust reporting systems in Jira
- Tips for integrating advanced Jira reporting into your decision-making process
- Discovering valuable intelligence for effective choices with Jira
- FAQ (Frequently Asked Questions)
Importance of data-driven decision-making for portfolio, project, and program managers
In today's business world, making the right decisions can be challenging, if not impossible, without access to accurate data. That's where data-driven decision-making comes in.
By using data to drive their decisions, managers can:
- Prioritize tasks, allocate resources, and adjust their strategies based on informed choices.
- Identify risks and opportunities more quickly and respond to them appropriately with the help of data.
- Improve transparency and accountability by providing stakeholders with clear, concise reports on project progress and performance.
Now that we have discussed the importance of data-driven decision-making for portfolio and project managers, let's explore the benefits of using Jira's reporting features for decision-making.
Benefits of using Jira's reporting features for decision-making
Jira is a powerful tool with extensive project reporting features that provide valuable insights into project performance, team productivity, and more. Here are some of the benefits of using it:
- Track key metrics: Jira enables you to track cycle time, lead time, and throughput to identify bottlenecks, predict delivery dates, and optimize processes to improve efficiency.
- Real-time reporting: it lets managers quickly make informed decisions.
- Customizable reports: managers can create custom reports to track specific metrics or project data.
- Integration with third-party tools: it integrates with various third-party reporting tools, including eazyBI, PPM Express, and PowerBI, enabling managers to create more advanced reports and visualizations.
Now that we have explored the benefits of using Jira's reporting features for decision making, let's give a quick overview of Jira's built-in reports and their functions.
Quick overview of Jira's built-in reports and their functions
Jira offers a variety of built-in reports. Here's a brief overview of some of them and their functions:
- Burndown chart: a visual representation of a project's progress. It shows the total work to be done versus the amount completed over time.
- Control chart: a statistical process control tool that helps managers identify trends in project performance. It shows how a particular metric, such as lead or cycle time, performs over time.

- Cumulative flow diagram: a chart showing how much work is in each project stage at any given time.
- Sprint report: an overview of a project's progress during a particular sprint. It includes metrics such as the number of completed tasks, the number of unresolved issues, and the number of issues added during the sprint.
- Time tracking report: this shows how much time team members spend on each task or issue.
The reports available in Jira may differ based on the type of project being used. For example, if you use Jira Software for Scrum teams, you will have access to reports such as the Burndown, Sprint, and Velocity charts. If you use Kanban boards, you will have access to the Cumulative flow diagram and Control chart.
But the instructions for creating these reports are the same for all types of projects:
- Click on the "Reports" option in the left-hand sidebar.
- Choose the type of report you want to generate from the list of available reports.
- Configure the report by selecting the appropriate options.
- Analyze the report to identify insights and areas for improvement.
- You can share a report by sending a link or granting access to specific users or groups.
Now that we have covered a quick overview of Jira's built-in reports and their functions, let's explore advanced techniques and add-ons for enhanced Jira reporting.
Advanced techniques and add-ons for enhanced Jira reporting
While Jira's built-in reporting features offer a great starting point for tracking project performance and making data-driven decisions, some advanced methods and add-ons can take your reporting to the next level.
Let’s explore some of them.
Generating automated alerts for improved project monitoring
Jira's native automation features enable users to set up automatic alerts to notify them when specific events occur, improving project monitoring and reducing the risk of missing important updates or issues.
How to create an automated alert in Jira:
- Click on "Project settings" in the left-hand sidebar and select "Automation" from the menu.
- Click "Create rule" in the top-right corner of the page.
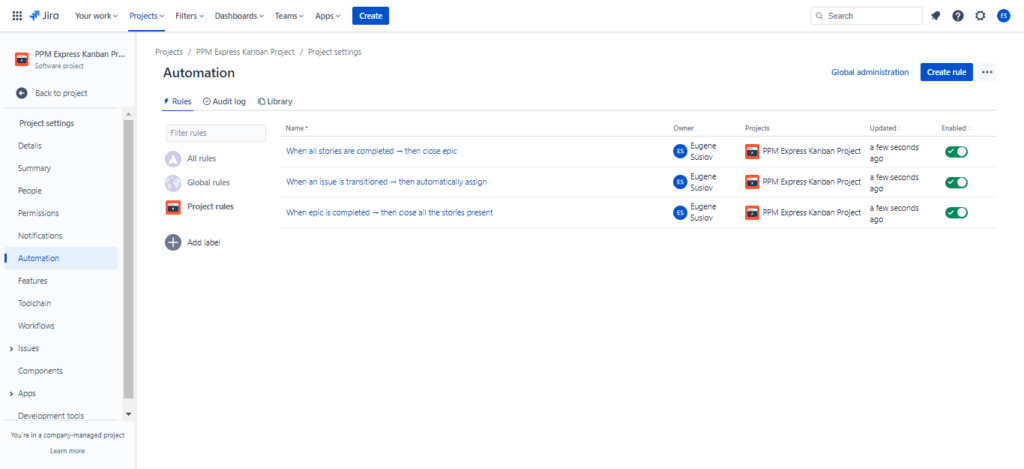
- Choose the type of trigger you want, such as an “Issue created" rule or an "Issue assigned" trigger.
- Configure the rule by selecting conditions and actions. For example, you can set a condition that triggers the rule when an issue is assigned a specific priority or when a due date is approaching. You can then set an action to notify a particular user or group via email or in-app.
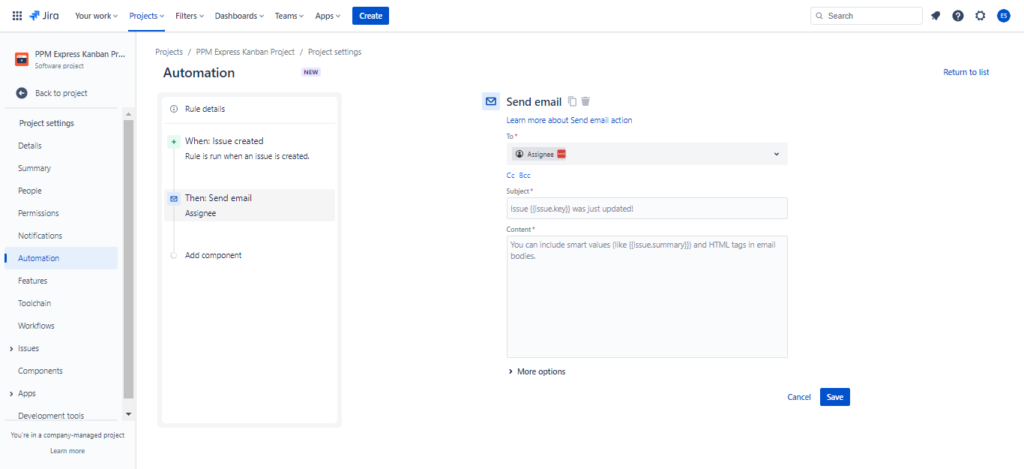
- Save and activate the rule by clicking the "Turn it on." button
Once the rule is activated, Jira will automatically monitor the project and trigger the alert when the conditions are met.
Users can view and manage their automation rules from the "Automation" page in the project settings.
Automated alerts can be a great way to stay on top of important updates and changes in your Jira projects.
However, custom dashboards can be handy for a more consolidated and holistic view of your projects. In the next section, we'll explore how to create custom dashboards in Jira.
Creating custom dashboards for a consolidated view
With custom dashboards, you can combine key metrics and reports in a single location, making it easier to identify trends, track progress, and make data-driven decisions.
To create a custom dashboard in Jira, follow these steps:
- Navigate to "Dashboards" at the top of the page.
- Click "Create dashboard" in the top-right corner of the page.

- Name the dashboard and choose its viewers and editors.
- Click "Add gadget.” Gadgets are pre-built data visualizations that can be added to the dashboard to display specific data types, such as issue statistics or project progress.

- Select the gadget you want to add from the list and configure it according to your needs.
- Repeat steps 4 and 5 for each gadget you want to add to the dashboard.
- Rearrange the gadgets on the dashboard as needed by dragging and dropping them to the desired location. You also can change the layout.
- Save the dashboard by clicking the “Done” button.
- You can change your privacy settings by clicking the “Rename or share” button and selecting the appropriate sharing settings.
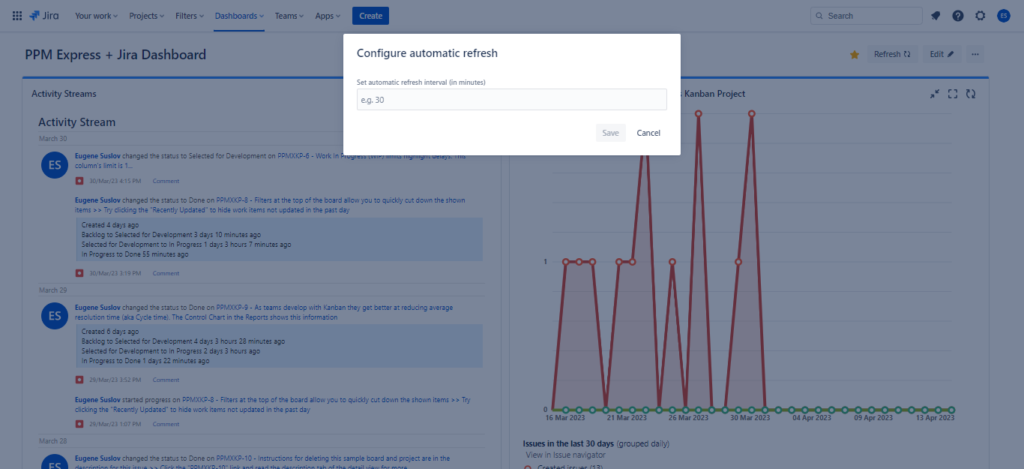
- Click on the "Refresh" button to update the data displayed on the gadgets.
- Alternatively, you can set the automatic refresh at specified intervals by clicking on "Edit" in the top right corner of the page and choosing the "Configure automatic refresh" option.
By following these simple steps, Jira users can create personalized dashboards tailored to their specific needs and preferences.
However, sometimes users need to filter that data even further to find the exact information they need. That's where Jira Query Language comes in. By using JQL to create custom filters, users can refine their data and uncover insights that might have been hidden otherwise. Let’s dive into the details.
Jira Query Language (JQL) for creating custom filters
Jira Query Language is a powerful tool that enables you to create custom filters to search for issues in Jira.
With JQL, you can specify criteria that must be met for an issue to be returned in the search results. There are several benefits of using JQL in Jira, such as:
- Precise searches: JQL enables more specific searches for faster results
- Customization: users can create and save their own custom filters and queries
- Automation: JQL can automate routine searches and reporting tasks
- Collaboration: saved filters can be shared with others for better collaboration and information sharing
- Flexibility: JQL can be used across different projects and issue types
To use JQL in Jira, follow these steps:
- Navigate to the "Filters" rollup menu in the top navigation menu.
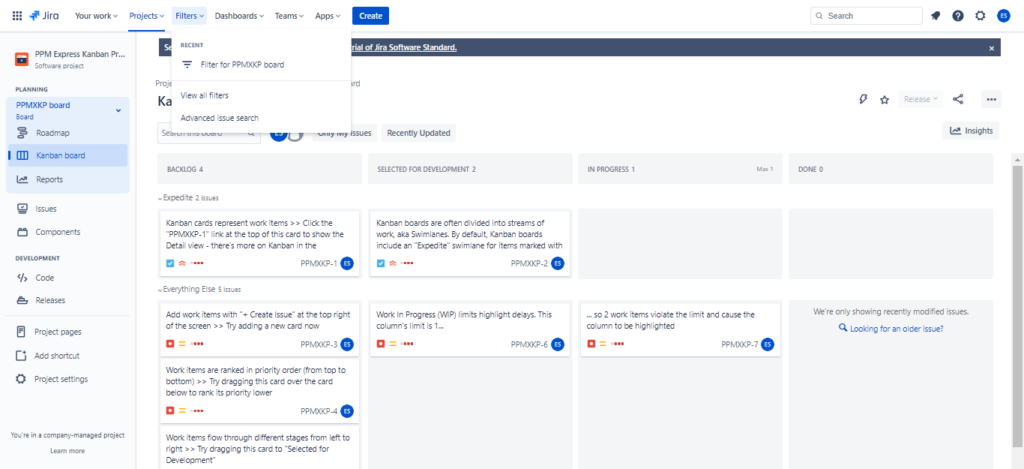
- Click the "Advanced issues search" link to access the JQL search bar.
- In the search bar, choose the “Switch to JQL” button.
- In the JQL search bar, enter the search criteria for the issues you want to find. For example, you could search for all issues assigned to a particular user or with a specific status.
- As you enter your search criteria, Jira will automatically suggest JQL search operators and functions help you refine your search.

- Click the "Search" button to run the search and view the results.
- You can save your JQL search as a custom filter by clicking the "Save as" button and giving your filter a name.
- You can access your custom filter any time by clicking the "Filters" option in the top navigation menu and selecting your filter from the list.
After creating custom filters with JQL, users can take their reporting to the next level by utilizing Jira Software REST API connectivity. This powerful feature allows for even more advanced reporting and data analysis, enabling users to extract and manipulate data from Jira in various ways.
Next-level reporting with Jira Software REST API connectivity
Jira Software REST API connectivity is an advanced technique enabling you to access Jira data programmatically.
REST API in Jira enables external applications to interact with Jira's data and functionality using HTTP requests and responses, making it possible to programmatically create, update, and retrieve issues and projects.
Here are some ways in which Jira Software REST API connectivity can enhance Jira reporting:
- Enhanced automation: it automates tasks and integrates Jira with other tools.
- Customization: it creates custom solutions for specific organizational needs.
- Real-time data access: REST API provides real-time access to Jira data for up-to-date reporting and analytics.
- Improved collaboration: it integrates Jira with other systems for better collaboration and information sharing.
To use the Jira REST API, follow these steps:
- Obtain an API token from your Jira instance. This token will be used to authenticate your API requests.
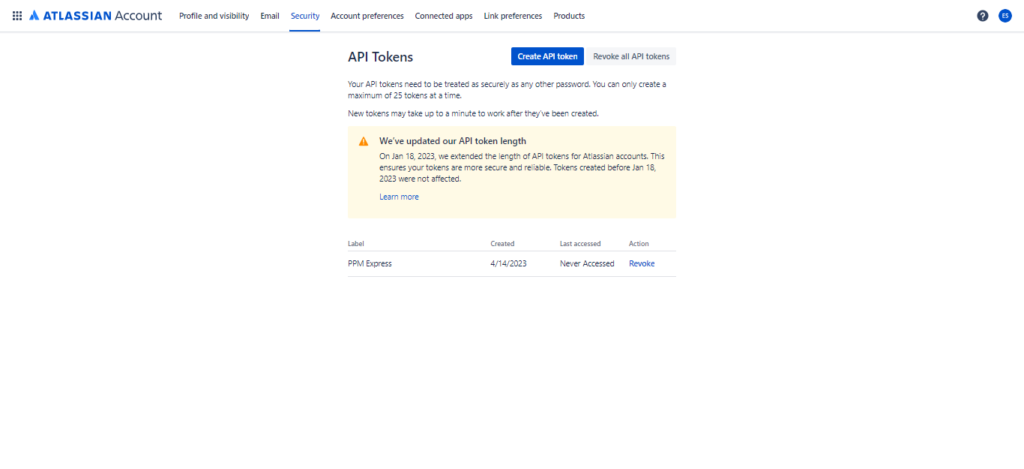
- Identify the API endpoint that you want to connect to. Jira Software provides a wide range of API endpoints that can be used to retrieve and update project data.
- Use a programming language to create a script or program that connects to the Jira REST API and retrieves the data you need. Many programming languages provide libraries or frameworks that simplify this process.
- Parse the data returned by the Jira REST API and use it to generate relevant reports or insights for your project.
It is important to note that using the Jira REST API requires some programming knowledge and expertise. Additionally, users should ensure that their API requests are secure and comply with the best data privacy and security practices.
Once you have harnessed the power of Jira's REST API connectivity, you can take your reporting to the next level by using advanced reporting techniques with Jira Command Line Interface (CLI).
Advanced reporting techniques with Jira Command Line Interface (CLI)
Jira Command Line Interface (CLI) is an advanced tool that enables you to automate Jira tasks, such as report generation or data extraction.
https://www.youtube.com/watch?v=ATAa5FNGcRk
With Jira CLI, you can perform complex reporting tasks from the command line or scripts. Here are some ways in which Jira CLI can enhance Jira reporting:
- Wide range of opportunities: perform complex admin or operational tasks across Atlassian (and other) apps with commands
- External data availability: use external data from CSV files, databases, and other apps to perform bulk operations on Jira issues
- Changes history: review a log of previous actions in a readable JSON file for auditing and troubleshooting
- Unified interface: available for both Jira and Confluence for managing both systems from a single command line interface.
Here's how to install and use Jira CLI:
- Download the Jira CLI distribution file from the Atlassian Marketplace.

- Extract the contents of the distribution file to a directory of your choice.
- Open a command prompt or terminal window and navigate to the directory where you extracted the Jira CLI files.
- Run the Jira CLI installer by executing the appropriate command for your operating system. For example, on Windows, run the install.bat file. On Unix-based systems, run the install.sh script.
- Follow the prompts in the installer to configure your Jira CLI installation. To complete the installation, you must provide your Jira instance URL and API token.
- Once the installation is complete, you can start using Jira CLI by running the appropriate commands for the tasks you want to perform.
By using Jira CLI, users can perform complex tasks with ease and speed, making it a powerful tool for managing Jira instances. However, it is crucial to use Jira CLI with caution and to follow the best data privacy and security practices.
After exploring advanced reporting techniques with Jira CLI, it's time to look at the top integrations and add-ons for building robust reporting systems in Jira.
Top 3 integrations and third-party add-ons for building robust reporting systems in Jira
Jira is a powerful tool for managing software projects, but to get the most out of it, you need to have robust reporting capabilities. Integrations and third-party add-ons can provide additional functionality to take Jira reporting to the next level.
This section will explore the best integrations and third-party add-ons for building robust reporting systems in Jira. Let's dive in and explore them.
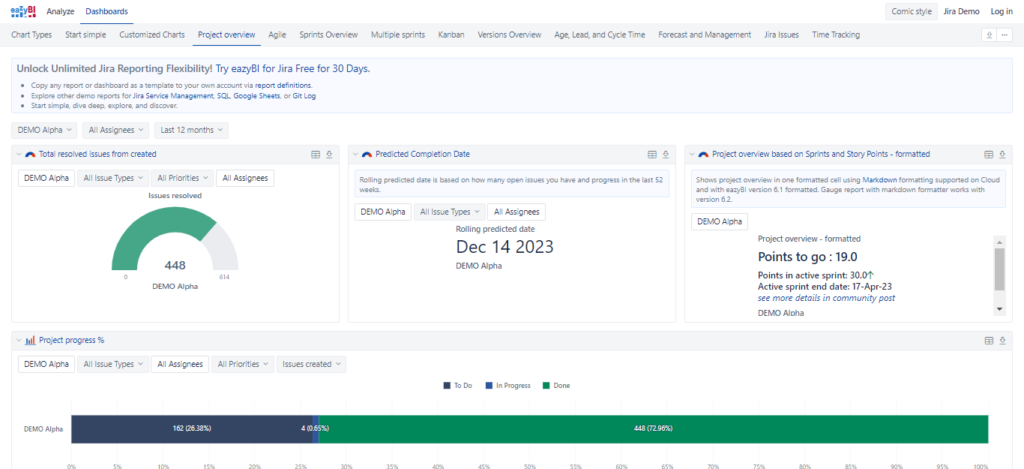
Visualizing Jira data with eazyBI for advanced reporting
eazyBI is a powerful business intelligence tool that allows Jira users to create custom reports, visualizations, and dashboards.
https://www.youtube.com/watch?v=DPWmb8aUlas
eazyBI is tailored explicitly to project managers and Jira users. Here are some of the ways in which eazyBI can enhance Jira reporting:
- Customizable reports: it allows users to create fully customizable reports using drag-and-drop functionality.
- Multi-dimensional analysis: eazyBI enables users to share data across multiple dimensions.
- Visualizations: it offers various visualization options, including charts, graphs, and pivot tables.
- Advanced calculations: eazyBI supports a wide range of advanced calculations and formulas.
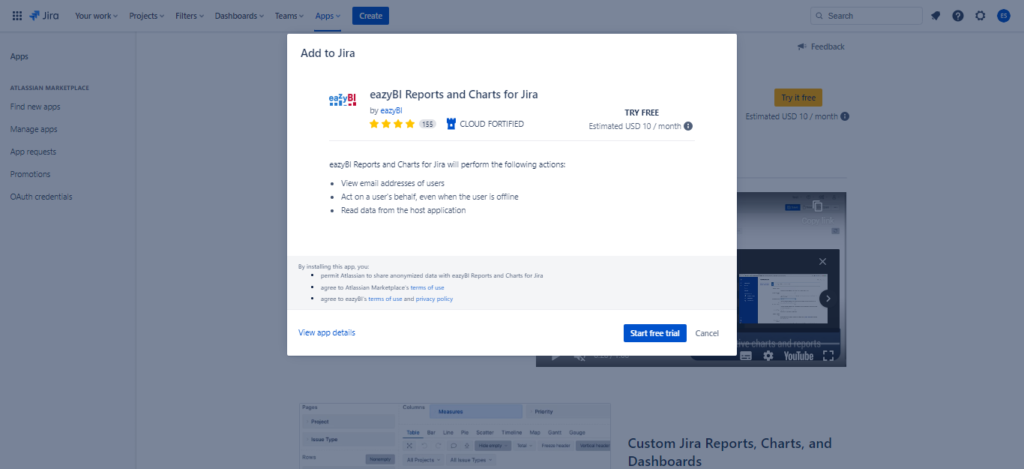
This is how to connect Jira Cloud to eazyBI:
- Go to Jira Settings, click "Apps", search for eazyBI, and click "Install”.
- If you haven't already, sign up for an eazyBI account.
- The first eazyBI account is created automatically after app installation.
- Open eazyBI and click "Add new source application" in the "Source Data" tab. Select "Jira" as the data source and enter the URL for your Jira instance. Then enter your Jira credentials to authorize the connection.

- Choose the Jira projects and issue types you want to import into eazyBI. You can also select custom fields and any other data you want to import.
- Once you have configured the data import settings, click "Import" to start the import process. This process may take several minutes.
- Once the import is complete, you can create custom reports and dashboards in eazyBI using your Jira data.
While eazyBI offers an all-in-one solution with customizable reports and dashboards, Power BI provides a more flexible platform for integrating data from multiple sources and creating interactive visualizations.
Now let’s discover Microsoft’s BI tool in detail.
Transforming data into actionable insights with Power BI
Power BI is a business analytics service that provides interactive visualizations and insights into data.
Here are some ways in which Power BI can enhance Jira reporting:
- Data visualization: it creates compelling visualizations of data to improve understanding and communication.
- Integration with multiple data sources: Power BI connects to various systems like Azure DevOps, Zendesk, and Google Analytics for combined data analysis.
- Interactive reporting: Power BI creates interactive reports for real-time data exploration and analysis.
- Collaboration: it provides collaboration features for the report and data insight sharing and collaboration.
- Scalability: it scales to handle large data volumes for enterprise-level organizations.
- Customization: Power BI customizes reports and dashboards to fit specific needs and requirements.
One of the main limitations of using Power BI with Jira compared with eazyBI is that there is no native connection between the two tools. There are different options for connecting Jira to Power BI, including:
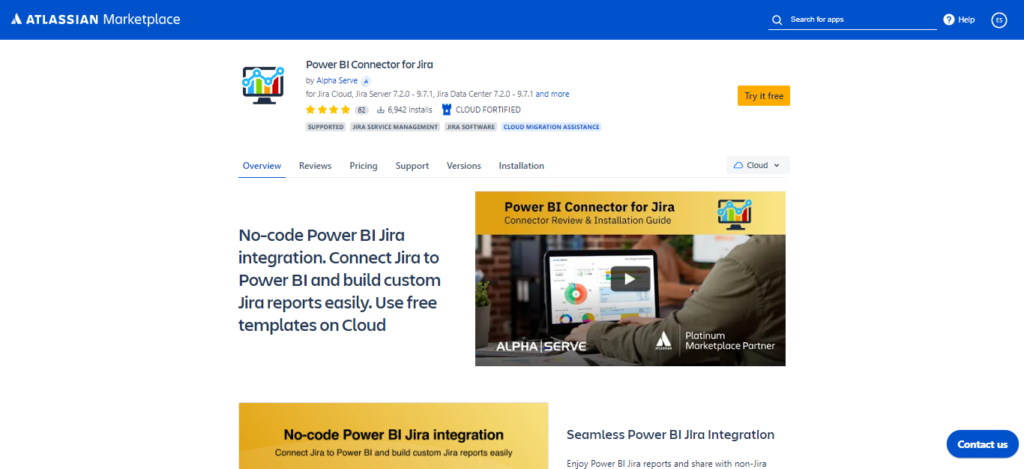
- Power BI Connector for Jira: this third-party app in the Atlassian Marketplace allows you to connect Jira Server or Data Center to Power BI.
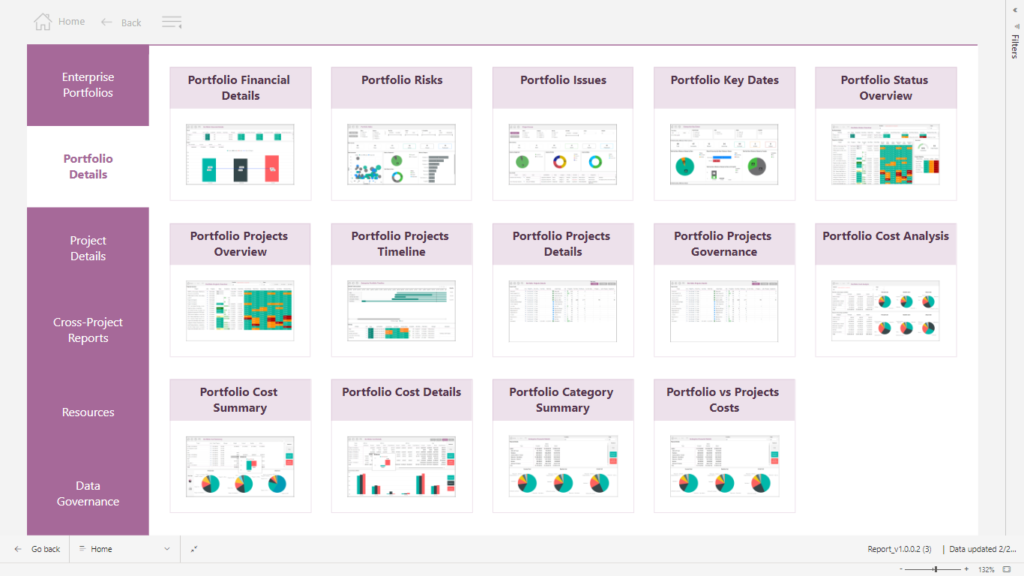
- PPM Express: this has built-in integrations with Power BI, so you can easily connect your Jira data to Power BI without additional connectors or technical expertise. PPM Express also provides pre-built reports and dashboards for Jira projects, making it easier to analyze and visualize your Jira data in Power BI.
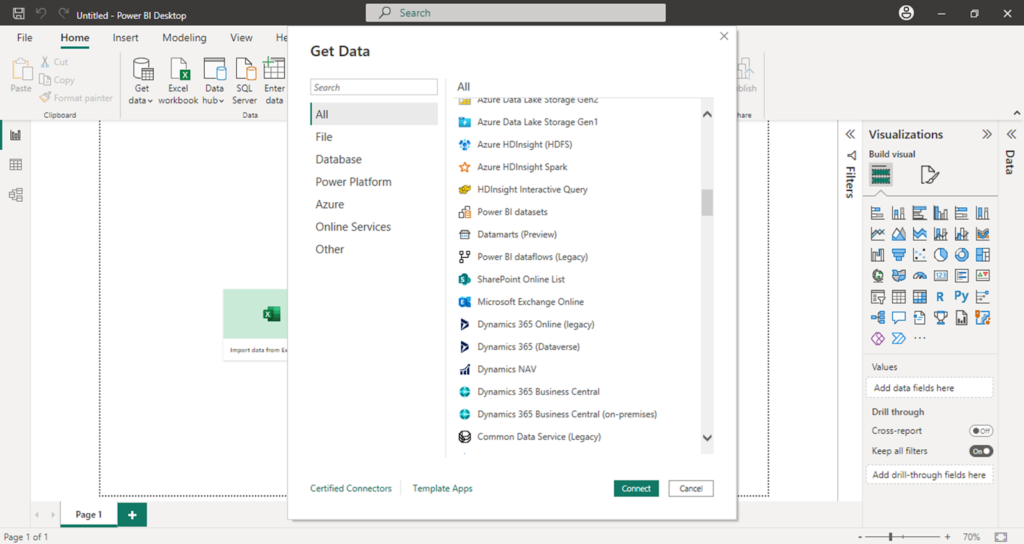
- Jira REST API: Power BI supports connection to Jira Cloud and Jira Server/Data Center through the Jira REST API. You must use the "Web" Power BI connector to the Jira REST API and authenticate with your Jira credentials.
Each option has advantages and limitations, so choosing the one that best suits your needs and technical expertise is important.
Transforming data into actionable insights with Power BI is essential for effective decision-making. You’ll need PPM Express to take it to the next level and manage your projects as a portfolio. Combining these two tools can help you make informed decisions and optimize your portfolio management. Let’s find out more about its features.
Deeper insights for enhanced decision-making with PPM Express
Managing an extensive portfolio of projects and programs can be challenging, especially when tracking progress, resources, and budgets across multiple teams and departments.
That's where PPM Express comes in.
With its robust portfolio and resource management features, PPM Express can help organizations gain deeper insights into project performance and make data-driven decisions for enhanced business outcomes.
Here are some ways in which combining Jira data with PPM Express can enhance Jira reporting:
- Portfolio management: manage Jira projects as a portfolio with an overview of statuses, timelines, and budgets
- Integration with other tools: seamlessly integrate with tools like Microsoft Project, Azure DevOps, Smartsheet, and Monday.com for streamlined project management
- Reporting and analytics: customizable Power BI and built-in dashboards, detailed project performance reports, and real-time analytics on resources, timelines, and budgets
- Resource management: manage project resources across all Jira projects with calendars, tracking, and real-time monitoring
Here's how to connect Jira to PPM Express:
- Sign up for a PPM Express account. After signing up, you will be taken to the PPM Express “Quick start” dashboard.
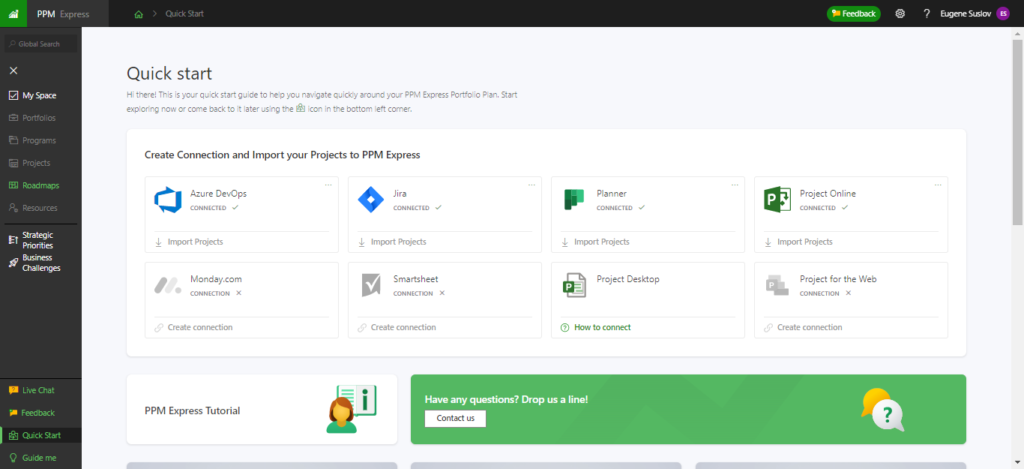
- Click on the button “Import projects” next to the Jira icon to begin the integration setup process.
- Follow the on-screen instructions to connect your Jira instance to PPM Express. To complete the setup process, you must provide your Jira URL, username, and API token.
- Once the Jira integration is set up, you can begin syncing your projects with PPM Express. To do this, navigate to the Portfolios, Projects, Programs, or Resources pages in PPM Express and click the "Import Project" button. Follow the on-screen instructions to complete the project setup process.
- Once the project is set up, you can manage it from the PPM Express dashboard. You can view project timelines, budgets, resources, and more and use PPM Express's reporting and analytics features to gain deeper insights into project performance.
Connecting Jira with PPM Express gives users a powerful toolset for project and portfolio management, enabling deeper insights and informed decision-making.
To fully leverage this integration, users can utilize certain tips for integrating advanced Jira reporting into their decision-making process, ensuring they use all available tools to make the most informed choices. Let's delve into some best practices.
Tips for integrating advanced Jira reporting into your decision-making process
Advanced Jira reporting can provide valuable insights that enable better decision-making for project and portfolio managers. However, integrating these reports into your decision-making process can be challenging.
We will provide tips and best practices for integrating advanced Jira reporting into your decision-making process.
Assessing your reporting needs and requirements
Before you start creating reports, it's important to understand what you need to report on and why. Here are some tips:
- Identify key questions: start by identifying the questions you need to answer with your reports. They should be aligned with your business objectives and should help you make better decisions.
- Determine metrics and KPIs: these should be relevant to your business objectives and provide insights that drive better decision-making.
- Define data sources: identify the sources relevant to your metrics and ensure that your data is accurate and current.
- Understand reporting formats: determine the reporting formats that will be most useful for your stakeholders, whether that be charts, tables, or visualizations.
- Establish reporting cadence: determine how frequently you need to generate reports and how often you need to share them with stakeholders.
The following section will explore the steps involved in setting up a robust reporting framework that aligns with your reporting needs and requirements.
Setting up a robust reporting framework
A robust reporting framework is critical for integrating advanced Jira reporting into your decision-making process. Here are some tips:
- Define reporting roles and responsibilities: determine who will be responsible for creating reports, who will be responsible for reviewing and approving them, and who will be responsible for distributing them.
- Create a reporting schedule: establish a reporting schedule that works for your organization: the frequency of reports and the format and content of them.
- Choose reporting tools: choose reporting tools that are well-suited to your organization's needs: Jira's built-in reports, third-party add-ons, or custom reporting solutions.
- Define report templates: create templates that align with your organization's reporting needs. You can use the prebuilt reports that PPM Express provides with Power BI.
- Establish data governance: create policies and procedures that ensure your data's accuracy, completeness, and consistency.
- Monitor and review reports: this includes tracking the effectiveness of your reporting framework, analyzing trends, and making adjustments as necessary.
While certain reporting tools may meet your needs in the short term, it is important to consider whether they will scale with your business as it grows and whether they are compatible with other systems and tools you use.
In the following section, we will explore some key factors to consider when evaluating the compatibility and scalability of reporting tools for your organization.
Evaluating the compatibility and scalability of the tools
Assessing the compatibility and scalability of reporting tools is critical for integrating advanced Jira reporting into your decision-making process.
Here are some tips:
- Compatibility with Jira and third-party tools: evaluate the integration of reporting tools with your organization's other tools. For example, PPM Express can integrate all your portfolio from Jira, Azure DevOps, Smartsheet, and Microsoft Project into one PPM environment seamlessly.
- Scalability: evaluate the scalability of reporting tools by considering the size of your organization, the number of projects, and the complexity of your data.
- Customizability: evaluate the customizability of reporting tools to ensure you can create reports that align with your organization's specific needs.
Even if a reporting tool is compatible and scalable, it may not be the best choice if it is difficult to use or if users resist adopting it.
In the following section, we will explore key factors to consider when evaluating your organization's learning curve and users’ adoption of reporting tools.
Ensuring data security, privacy, and culture
Ensuring data security and privacy, alongside a positive data culture, is critical for integrating advanced Jira reporting into your decision-making process.
Here are some tips:
- Data access and encryption: establish access and use encryption to protect sensitive data transmitted over networks or stored in databases. Implement user authentication to ensure only authorized personnel can access reporting tools and data.
- Data backup and recovery: establish data backup and recovery processes to ensure that data is not lost during a system failure or security breach. Ensure data is accurate, reliable, and consistent.
- Compliance with data regulations: ensure your reporting processes comply with data regulations such as GDPR, HIPAA, and CCPA.
- Communicate the importance of data: explain how data can help to improve decision-making and drive better outcomes in order to encourage team members to develop the skills to analyze data and create reports.
- Analyze feedback: identify areas for improvement on a report’s accuracy, usefulness, and usability. Ensure reporting processes align with business goals and objectives.
- Review reporting metrics: identify areas where reporting processes can be improved.
- Identify opportunities for automation: identify opportunities for automating reporting processes to improve efficiency and reduce errors. This may include using tools and features like PPM Express, Jira REST API, and CLI to automate report generation and distribution.
Ensuring the security and privacy of data, alongside a robust data culture, is critical for the successful integration of advanced Jira reporting into your decision-making process.
With these measures in place, you can confidently leverage the power of data to make informed decisions and achieve better outcomes.
Discovering valuable intelligence for effective choices with Jira
Jira and its powerful reporting features and add-ons enable project and portfolio managers to access a wealth of data and insights that can drive better decisions, reduce risks, and improve outcomes.
Whether you're using Jira's built-in reports, third-party add-ons like eazyBI and Power BI, or integrated platforms like PPM Express, you can unlock the full potential of your data to gain a competitive edge and achieve your strategic goals.
To discover valuable intelligence for effective choices with Jira, we recommend exploring PPM Express. This powerful project portfolio management tool integrates with Jira and provides advanced reporting and analytics capabilities.
With PPM Express, you can access a consolidated view of your projects and portfolios, track progress and performance, and generate customizable reports and dashboards.
Discover how PPM Express can help you make data-driven decisions and achieve better outcomes for your organization with a free trial.
FAQ (Frequently Asked Questions)
What are the benefits of using Jira's built-in reports for decision-making? Jira's built-in reports provide valuable insights into project status, progress, and performance. They enable users to quickly identify issues, track progress, and make data-driven decisions based on real-time data.
What advanced reporting techniques can I use in Jira? There are various advanced reporting techniques that you can use in Jira, such as Jira Query Language (JQL) for creating custom filters, REST API connectivity for next-level reporting, and Command Line Interface (CLI) for automating reporting processes.
How can I ensure data security and privacy using Jira reporting tools? To ensure data security and privacy, you can establish data access controls, use data encryption, implement user authentication, establish data backup and recovery processes, and comply with data regulations such as GDPR, HIPAA, and CCPA.
How can I foster a data-driven culture within my team? To foster a data-driven culture, you can communicate the importance of data-driven decision-making, provide training and support, encourage data sharing, establish data governance policies, and recognize achievements.
What is PPM Express, and how can it enhance my Jira reporting capabilities? PPM Express is a project portfolio management tool that integrates with Jira and provides advanced reporting and analytics capabilities. With PPM Express, you can access a consolidated view of your projects and portfolios, track progress and performance, and generate customizable reports and dashboards.
How can I continuously refine and improve my reporting processes in Jira? To continuously refine and improve your reporting processes, you can analyze feedback, review reporting metrics, collaborate with stakeholders, identify opportunities for automation, and regularly review data quality.
What are the best practices for integrating advanced Jira reporting into my decision-making process? Some best practices for integrating advanced Jira reporting into your decision-making process include assessing your reporting needs and requirements, setting up a robust reporting framework, considering the learning curve and user adoption, ensuring data security and privacy, fostering a data-driven culture within the team, and continuously refining and improving reporting processes.